The weather and short days generally make January a slower time for real estate. It’s normal for prices to shift down and properties to spend more time on market.
However, thanks to the new year and tax returns on the horizon, many home buyers and sellers are gearing up to enter the housing market soon.
If that’s your situation, seeing Columbus real estate trends in the full report below will help you get a sense of where the market is now and where it is headed.
- 🏘️ Columbus OH Homes For Sale, Listed, Sold, & Pending
- 📏Average Price Per Square Foot in Central Ohio
- 📉Days on Market in Central Ohio
- 💲Central OH Home Prices
- 🏘️ Months Of Inventory in Central Ohio
- 📈Columbus OH Area Absorption Rate
- Central Ohio Real Estate Market Report At A Glance
- Columbus OH Home Sellers
- Columbus OH Home Buyers
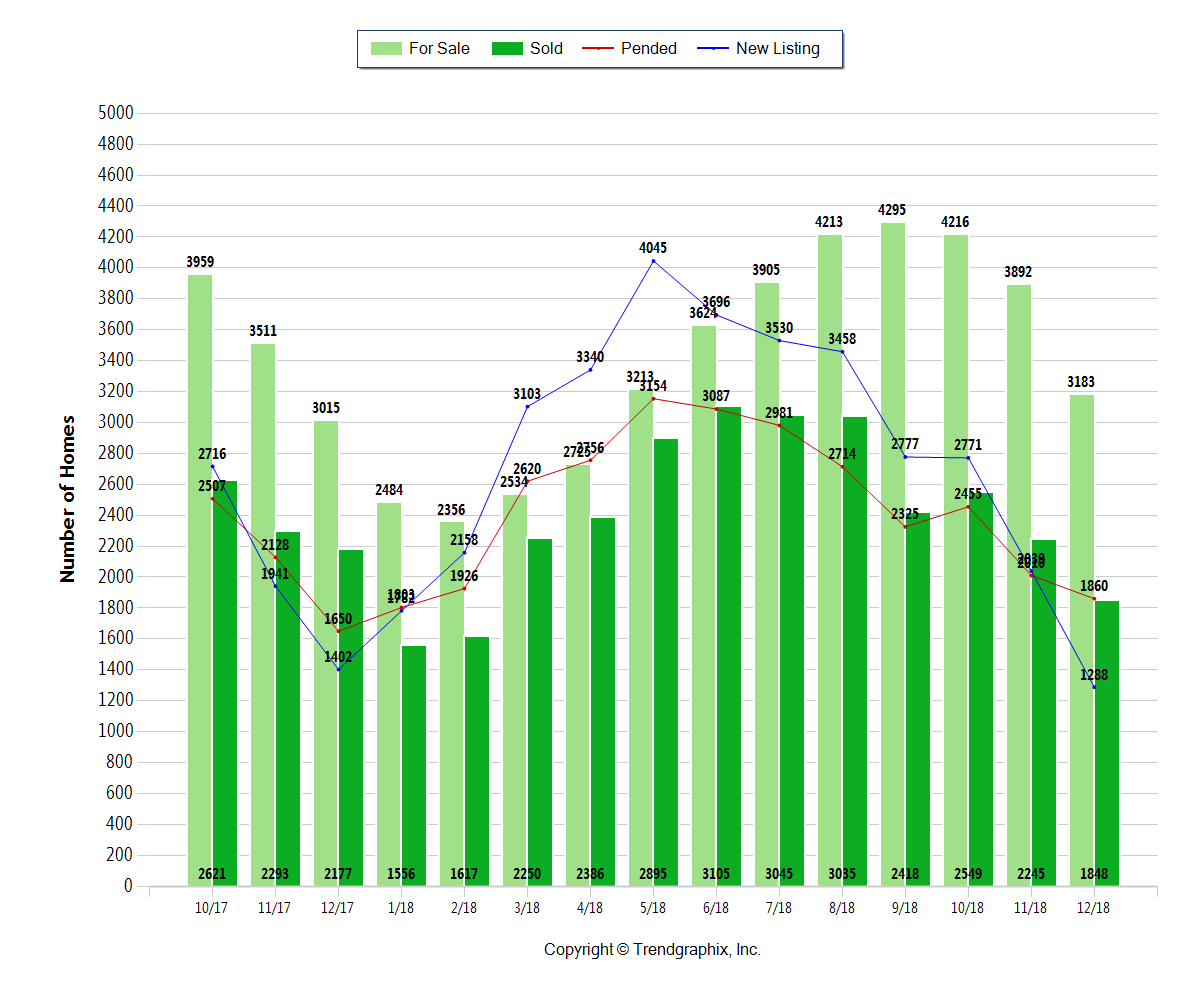
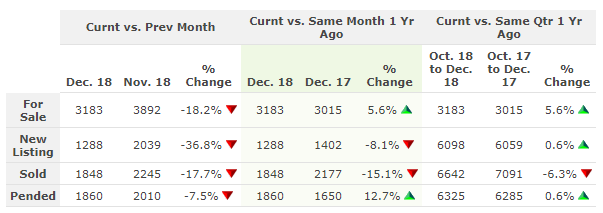
🏘️ Columbus OH Homes For Sale, Listed, Sold, & Pending
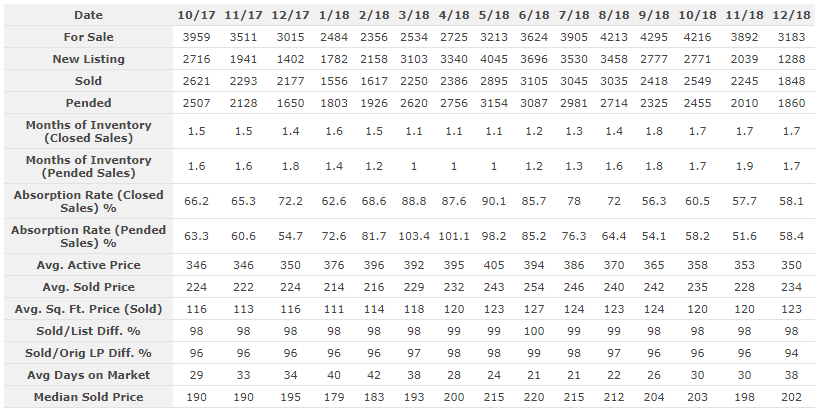
The number of Homes For Sale in December 2018 was 3183 units.
•  Down 18.2% compared to Nov 2018
•  Up 5.6% compared to Dec 2017
The number of Homes Listed in December 2018 was 1288 units.
• Down 36.8% compared to Nov 2018
• Down 8.1% compared to Dec 2017
The number of Homes Sold in December 2018 was 1848 units.
• Down 17.7% compared to Nov 2018
• Down 15.1% compared to Dec 2017
The number of Homes Placed Under Contract in December 2018 was 1860 units.
• Down 7.5% compared to Nov 2018
• Up 12.7% compared to Dec 2017
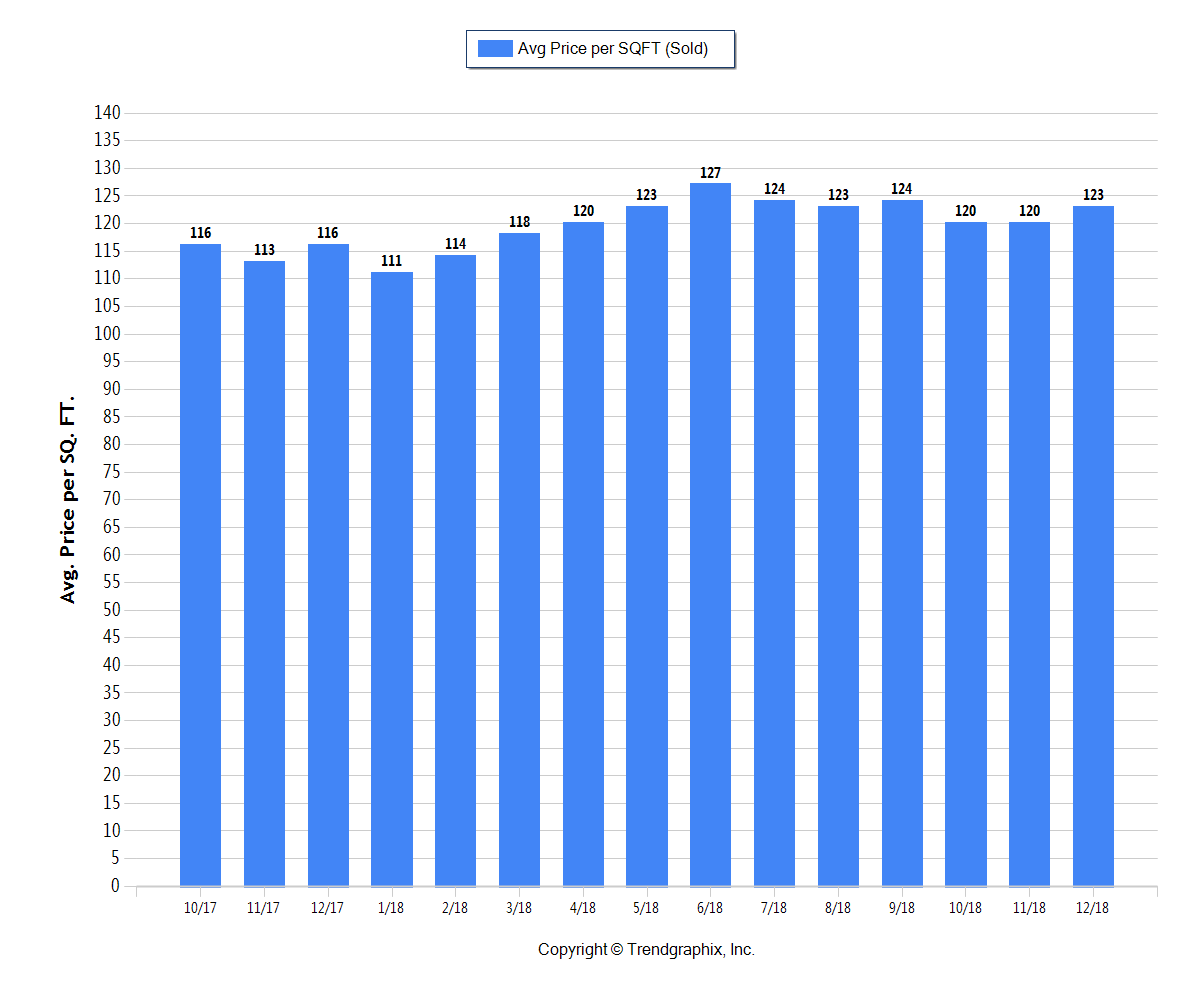
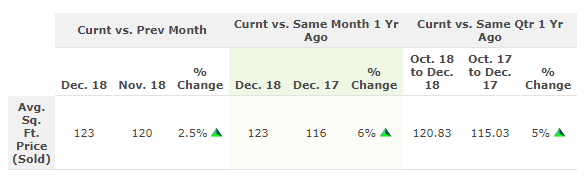
📏Average Price Per Square Foot in Central Ohio
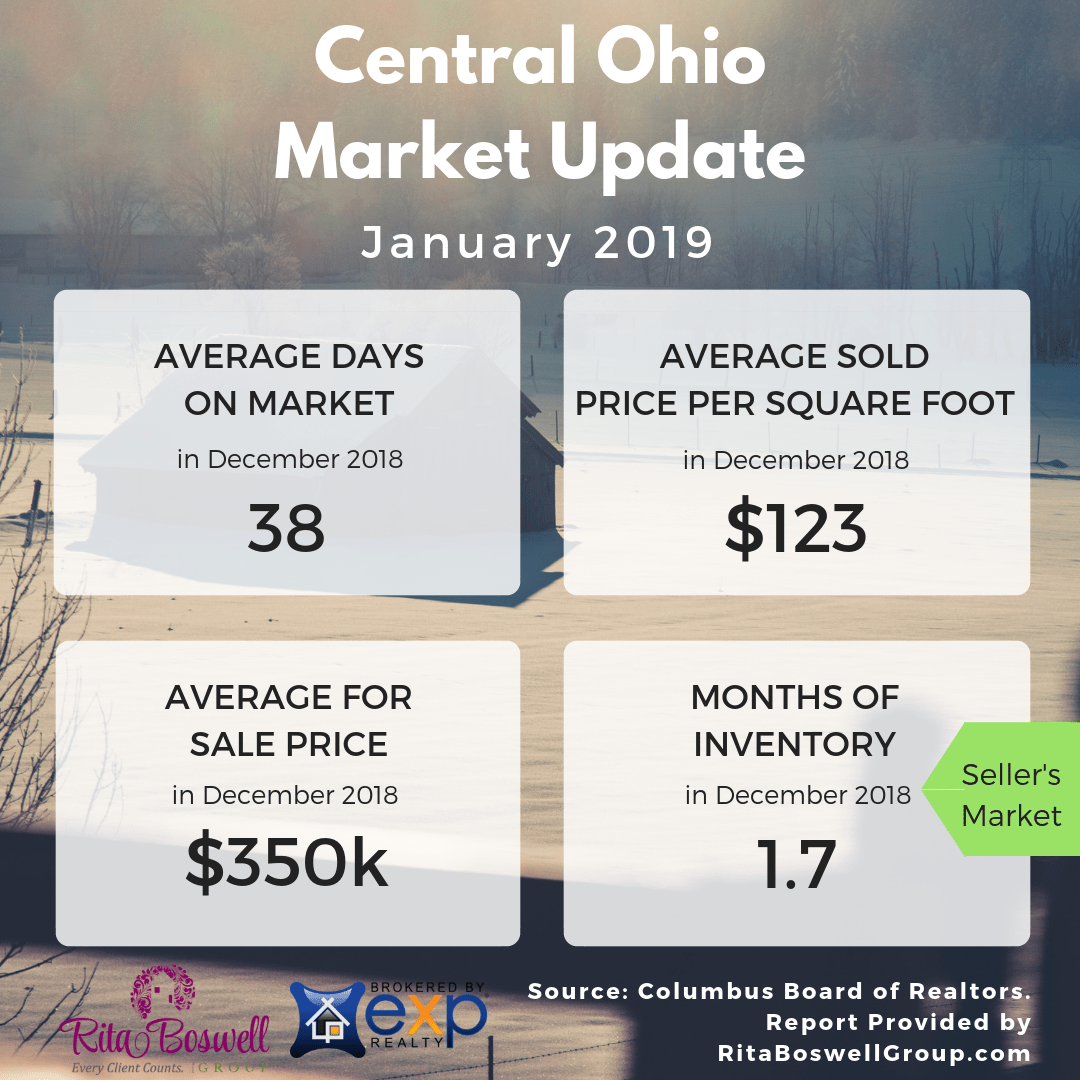
The Average Price per Square Foot on Sold homes moved up in December to $123.
• Up 2.5% compared to Nov 2018
• Up 6% compared to Dec 2017
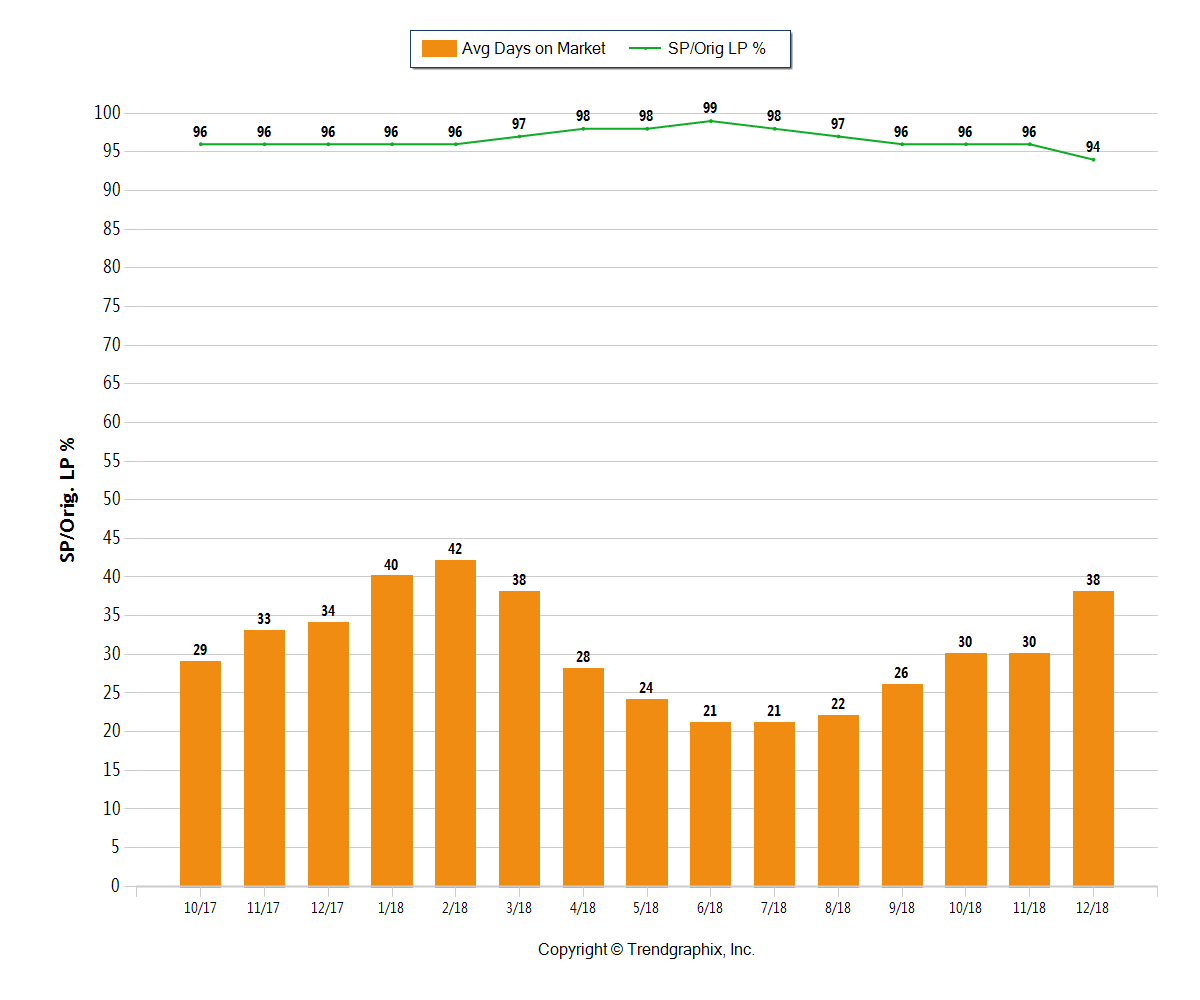
📉Days on Market in Central Ohio
The average Days On Market trend in Central Ohio is Rising*
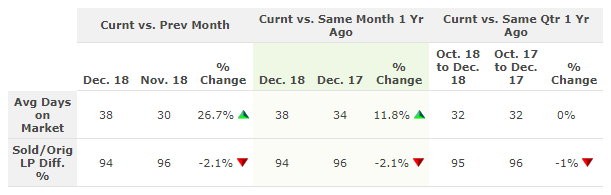
The Average Days on Market in December 2018 was 38 days.
• Up 26.7% compared to Nov 2018
• Up 11.8% compared to Dec 2017
The Sold/Original List Price Ratio fell* to 94% in December 2018.
• Down 2.1% compared to Nov 2018
• Down 2.1% compared to Dec 2017
*Based on 6 month trend – Rising/Falling/Remains Steady
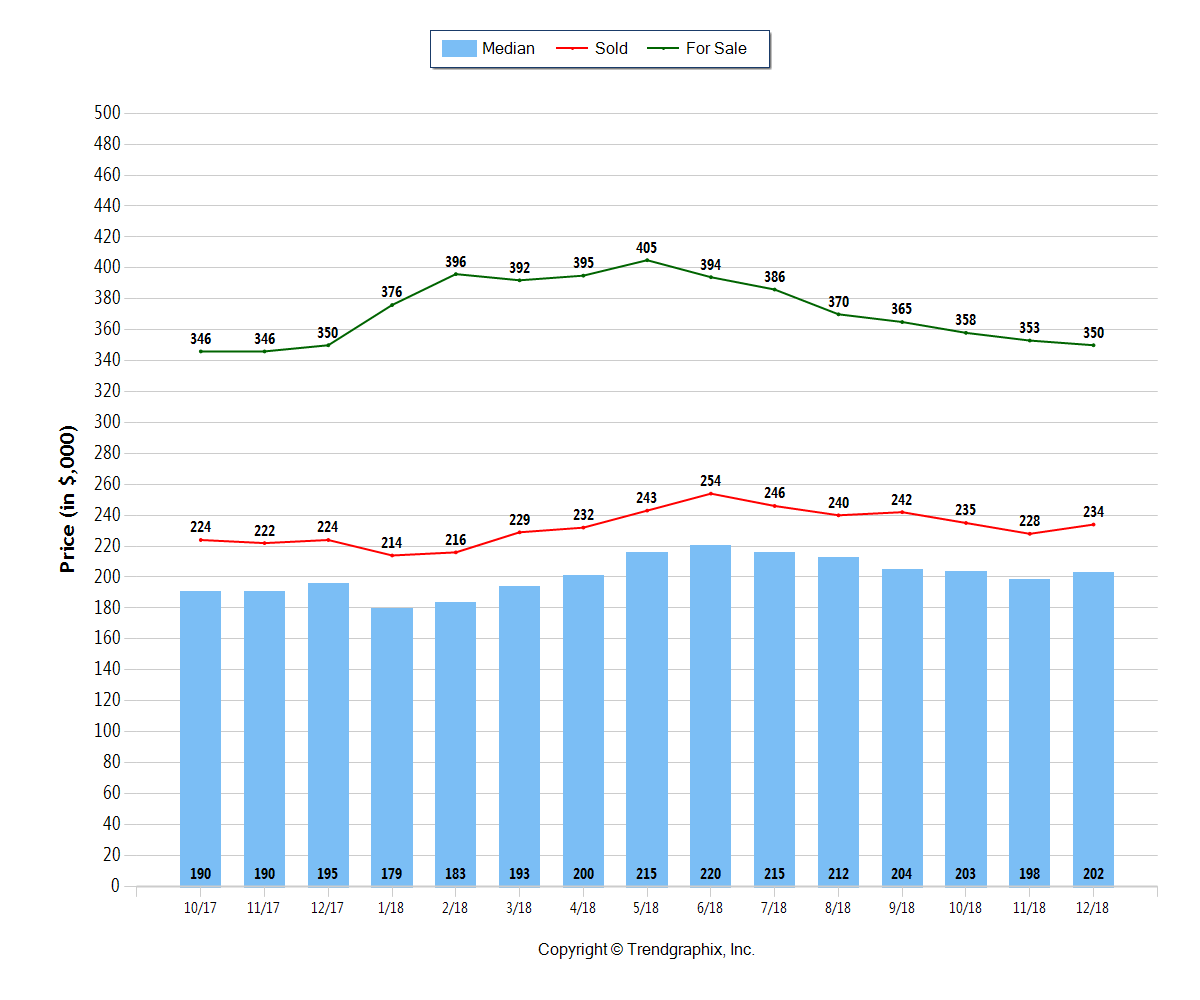
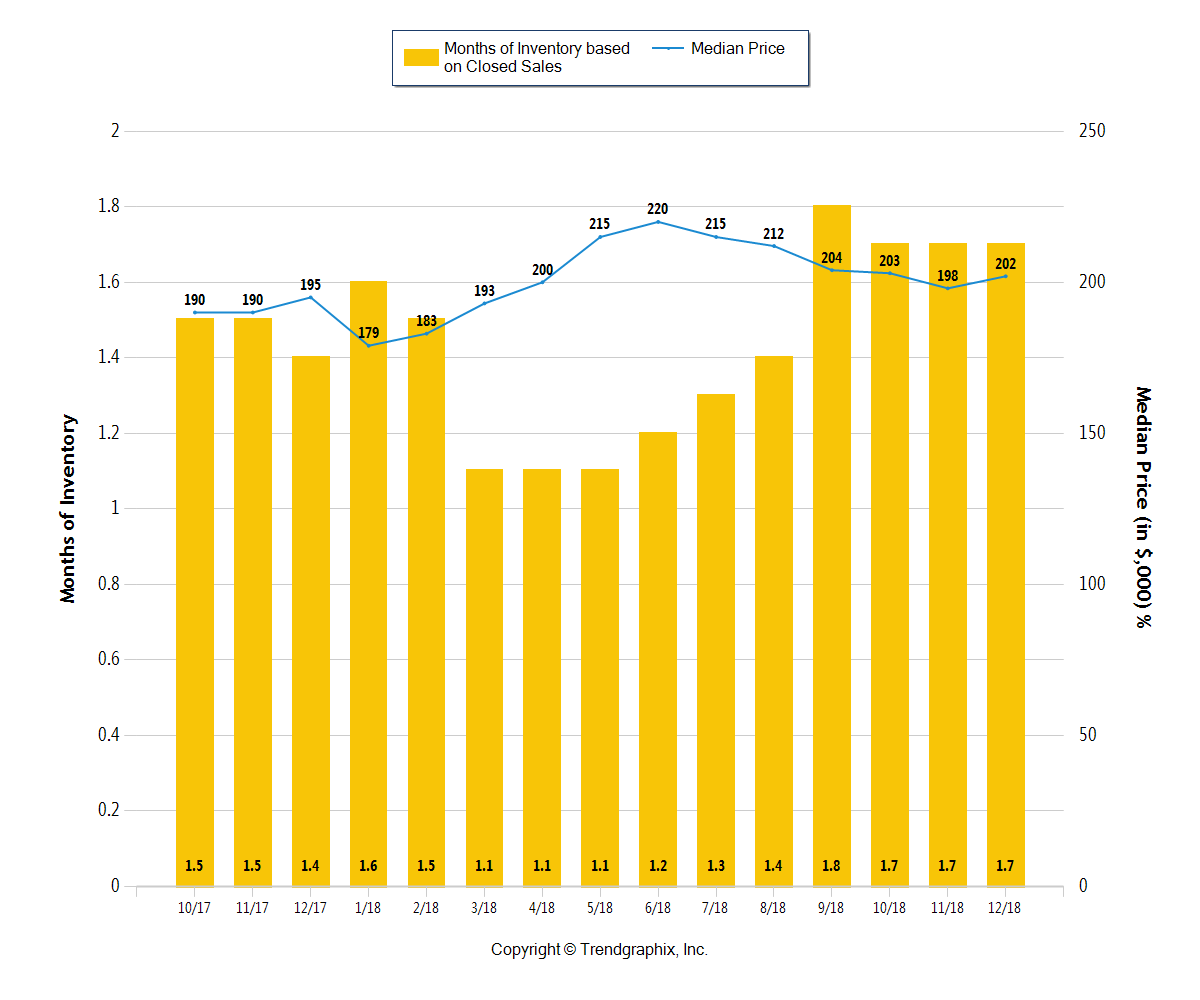
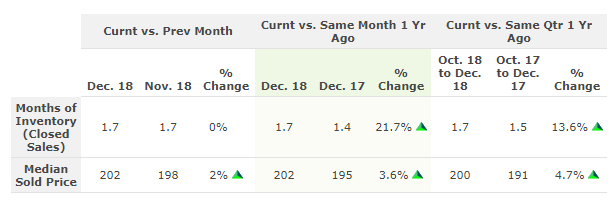
💲Central OH Home Prices
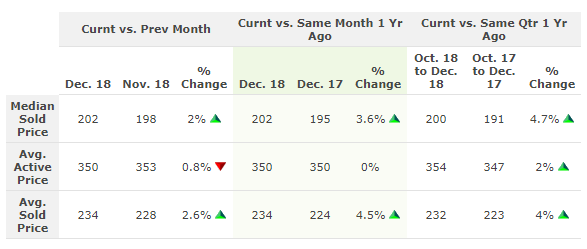
The Median Sold Price trend was neutral* in the Columbus area for December 2018 at $202k.
• Up 2% compared to Nov 2018
• Up 3.6% compared to Dec 2017
The Average For Sale Price trend fell* in Columbus to $350k.
• Down 0.8% compared to Nov 2018
• 0% compared to Dec 2017
The Average Sold Price trend was neutral* in Columbus at $234k.
• Up 2.6% compared to Nov 2018
• Up 4.5% compared to Dec 2017
*Based on 6 month trend – Appreciating/Depreciating/Neutral
🏘️ Months Of Inventory in Central Ohio
It remains a Seller’s Market* in Columbus, Ohio!
The Months of Inventory based on Closed Sales in December 2018 was 1.7.
• 0% compared to Nov 2018
• Up 21.7% compared to Dec 2017
*Seller’s market: less than 3 months of inventory based on closed sales
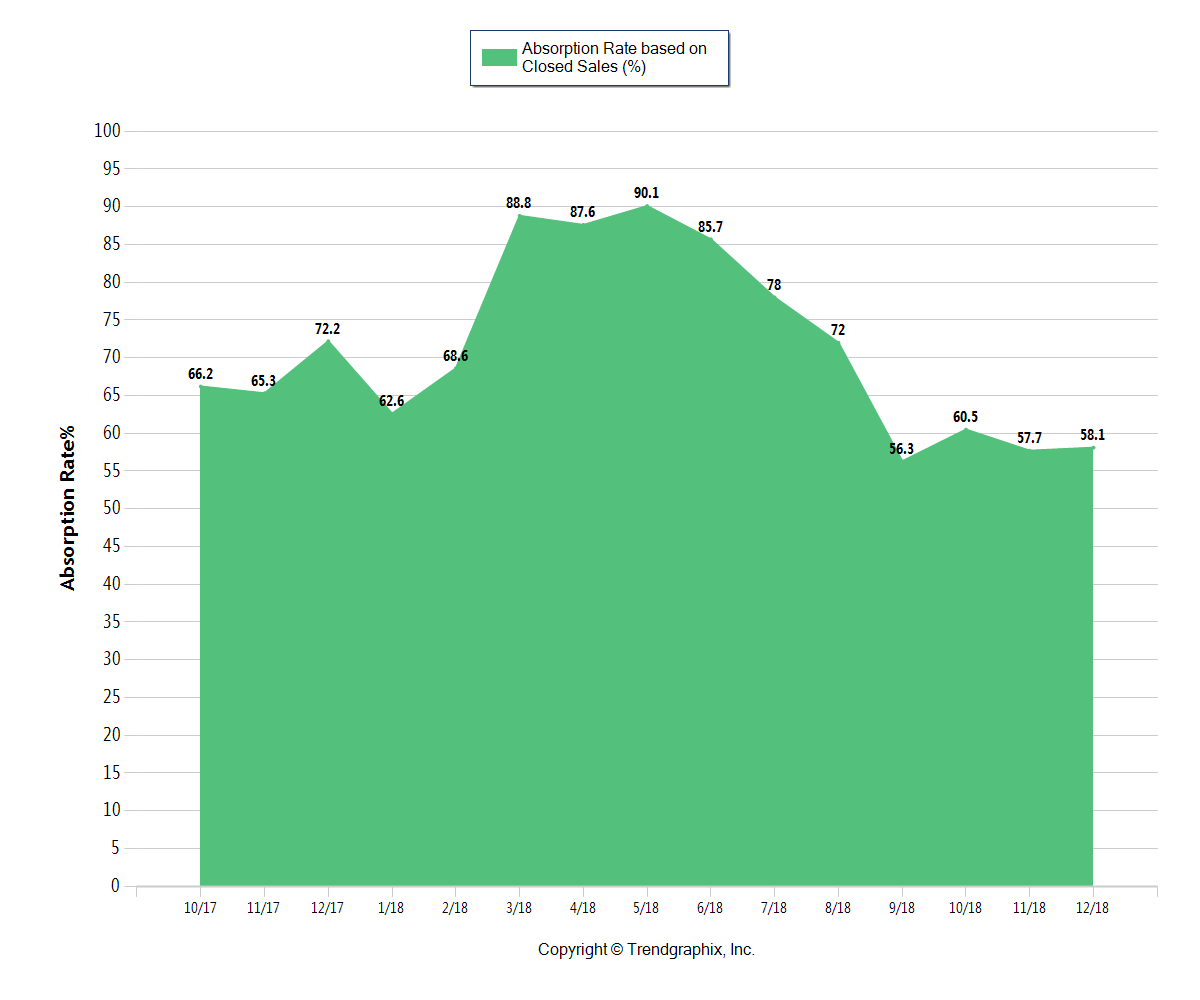
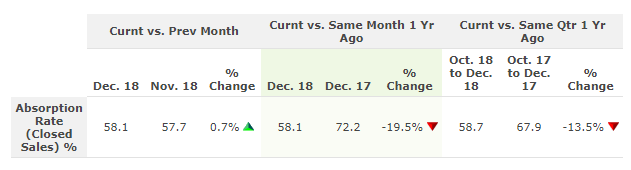
📈Columbus OH Area Absorption Rate
The Absorption Rate based on Closed Sales in December 2018 was 58.1%.
• Up 0.7% compared to Nov 2018
• Down 19.5% compared to Dec 2017
*Seller’s market: 33.33% and above based on closed sales
Central Ohio Real Estate Market Report At A Glance
Use this table to quickly see how the Columbus, Ohio area real estate market is doing.
Columbus OH Home Sellers
If you’re selling your home soon, it remains a Seller’s Market. Short days and cold weather hamper home buyer activity, generally leading to longer days on market in January.
Many people use tax returns towards a home purchase, so that will be a big driver of home buyer activity moving into February and March. That makes this a great time to talk with an experienced Realtor about getting your home ready to be listed for sale.
Central Ohio’s current Seller’s Market continues to be driven by lower priced homes. Higher priced homes are in a Buyer’s Market.
Call or text Columbus Realtor Rita Boswell at 614-830-9767 to learn more about market conditions for your home.
Get Your Home’s Value InstantlyColumbus OH Home Buyers
As people look towards tax season, you may be thinking about what to do with your tax return. Many use their tax returns towards a home purchase. This is a smart way to build wealth. Even if you’re only getting a little bit back from Uncle Sam, it may be enough for a down payment. Once you know how much you will get back, consult a mortgage professional to see if you can invest it in real estate.
February 23 has been noted as the BEST day to buy a home in Columbus. To take advantage of the slightly lower prices and less frantic market conditions of winter, start your home search now.
About Central Ohio Real Estate Market Reports
“At the Rita Boswell Group, our goal is to provide home buyers and sellers with the most recent, in-depth market information possible.
Our report is based on data supplied by the Columbus Board of Realtors or its MLS. Information is deemed reliable but not guaranteed. Specific data points provided above may be adjusted, which will be reflected in future reports.
Our Central Ohio real estate market reports cover the counties of Franklin, Delaware, Fairfield, Licking, Madison, Pickaway, and Union. For market information on a specific community, contact Realtor Rita Boswell at 614-830-9767.”