The Columbus area continued to be in a strong seller’s market in February, despite the weather. Home prices are coming down slightly each month (normal for this time of year) – which is good for buyers. BUT, inventory is still incredibly low which is resulting in bidding wars, no contingencies, and favorable conditions for sellers.
Consistently low inventory and higher demand are driving up prices year over year. The market normally slows down around this time of year, but this year has certainly been an outlier.
Read below to find out how the Columbus, OH housing market is doing and see what’s going on with the market at the moment. “Today’s Stats” are also included so you can see how things have changed as of the time of writing (March 14th, 2021).
If you need to buy or sell a home, please contact us at 614-830-9767. You can always begin your home buying journey online from the comfort of your home at RitaBoswellGroup.com. You can even find sold homes on our site!
- 🏘️ Central Ohio Homes For Sale, Listed, Sold, & Pending
- 📐Central Ohio Average Price Per Square Foot
- 📉Central Ohio Days on Market
- 💲Central Ohio Housing Prices
- 🏘️ Central Ohio Months Of Inventory
- 📈Central Ohio Absorption Rate
- Central Ohio Housing Market Report At A Glance
- Central Ohio Home Sellers
- Columbus OH Home Buyers
- Get Your Local Market Snapshot
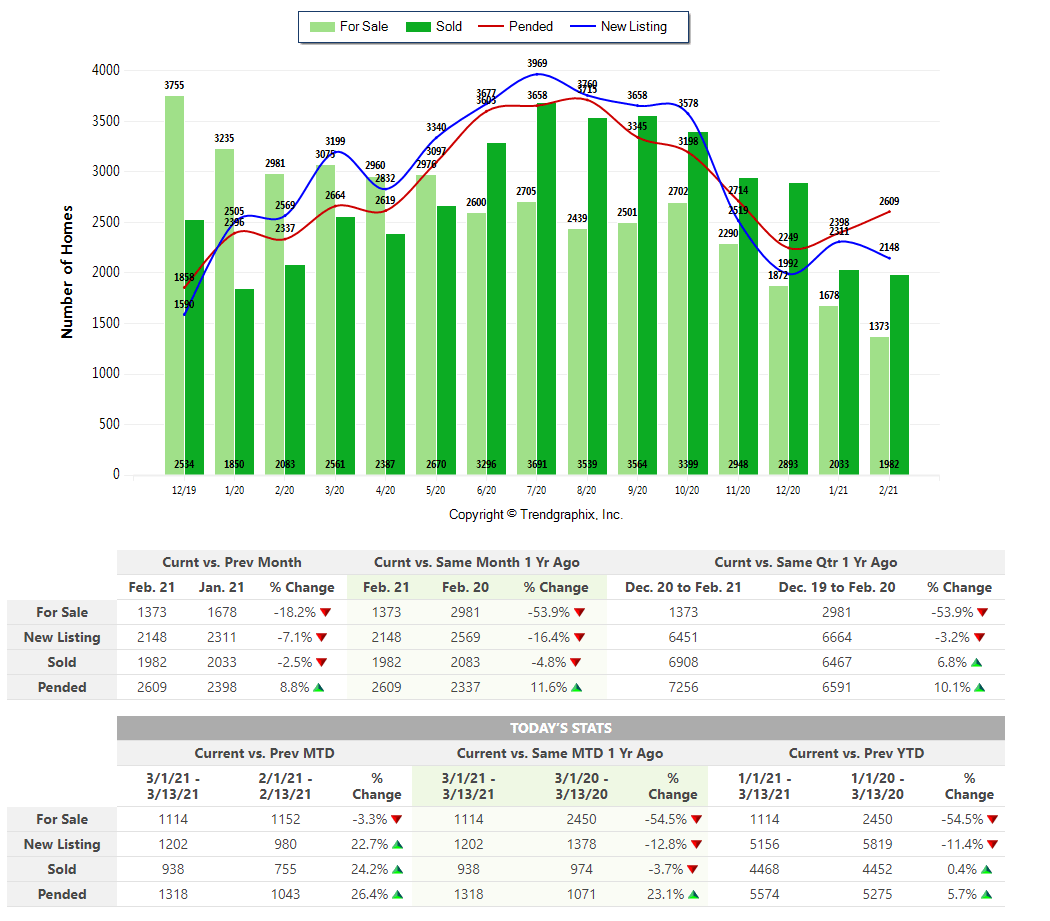
🏘️ Central Ohio Homes For Sale, Listed, Sold, & Pending
The number of Homes For Sale in February 2021 was 1373 units.
•  Down 18.2% compared to January 2020
• Down 53.9% compared to February 2020
The number of Homes Listed in February 2021 was 2148 units.
• Down 7.1% compared to January 2020
• Down 16.4% compared to February 2020
The number of Homes Closed in February 2021 was 1982 units.
• Down 2.5% compared to January 2020
• Down 4.8% compared to February 2020
The number of Homes Placed Under Contract in February 2021 was 2609 units.
•  Up 8.8% compared to January 2020
• Up 11.6% compared to February 2020
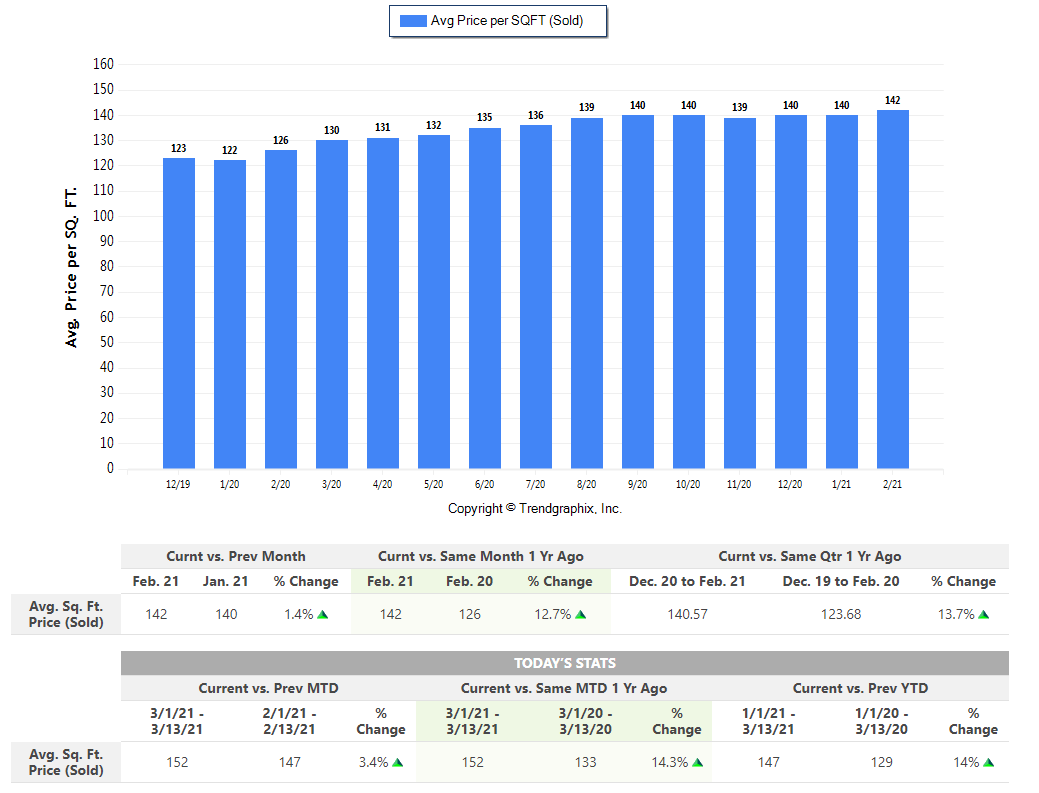
📐Central Ohio Average Price Per Square Foot
The Average Price per Square Foot on Sold homes trend is Appreciating.* In February 2021 the Average Price Per Square Foot was $142.
• Up 1.4% compared to January 2020
• Up 12.7% compared to February 2020
*Based on 6-month trend – Appreciating/Depreciating/Neutral
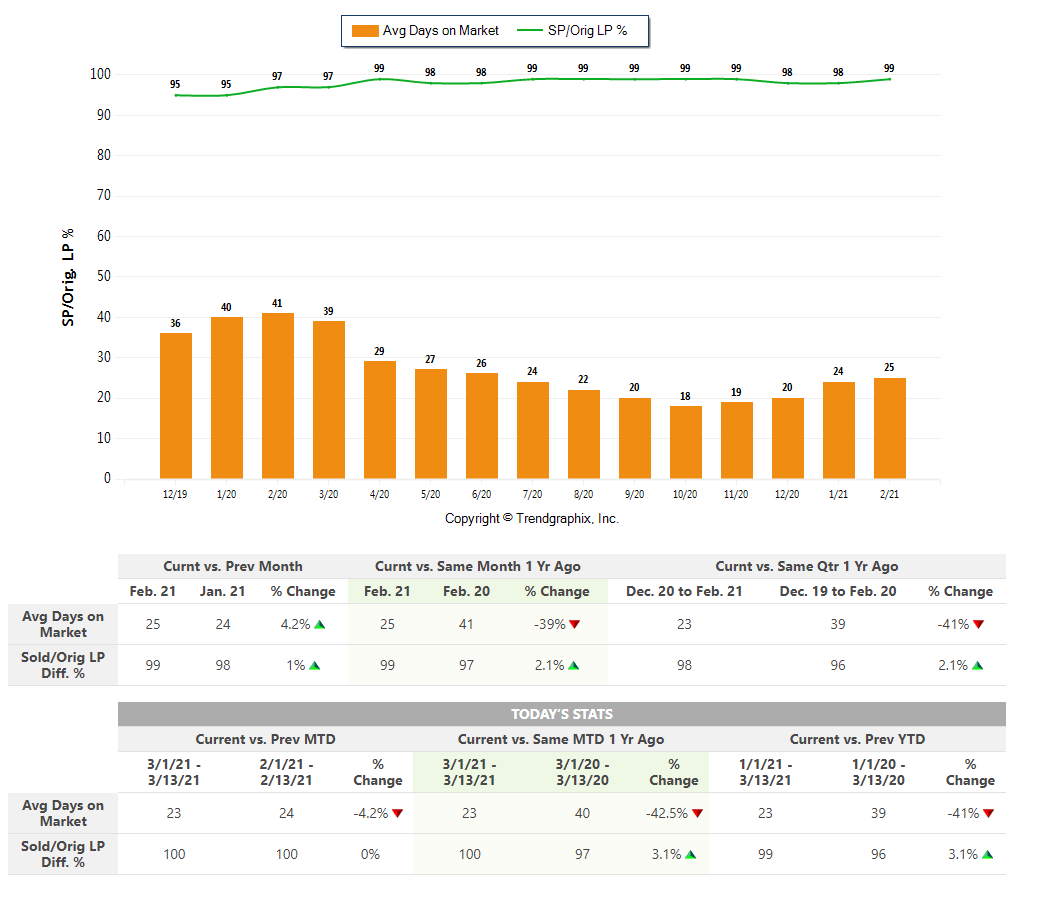
📉Central Ohio Days on Market
The average Days On Market trend in the Columbus area is Rising.*
The Average Days on Market in February 2021 was 25 days.
• Up 4.2% compared to January 2020
• Down 39% compared to February 2020
The Sold/Original List Price Ratio Remains Steady* at 99% for February 2021.
• Up 1% compared to January 2020
• Up 2.1% compared to February 2020
*Based on 6-month trend – Rising/Falling/Remains Steady
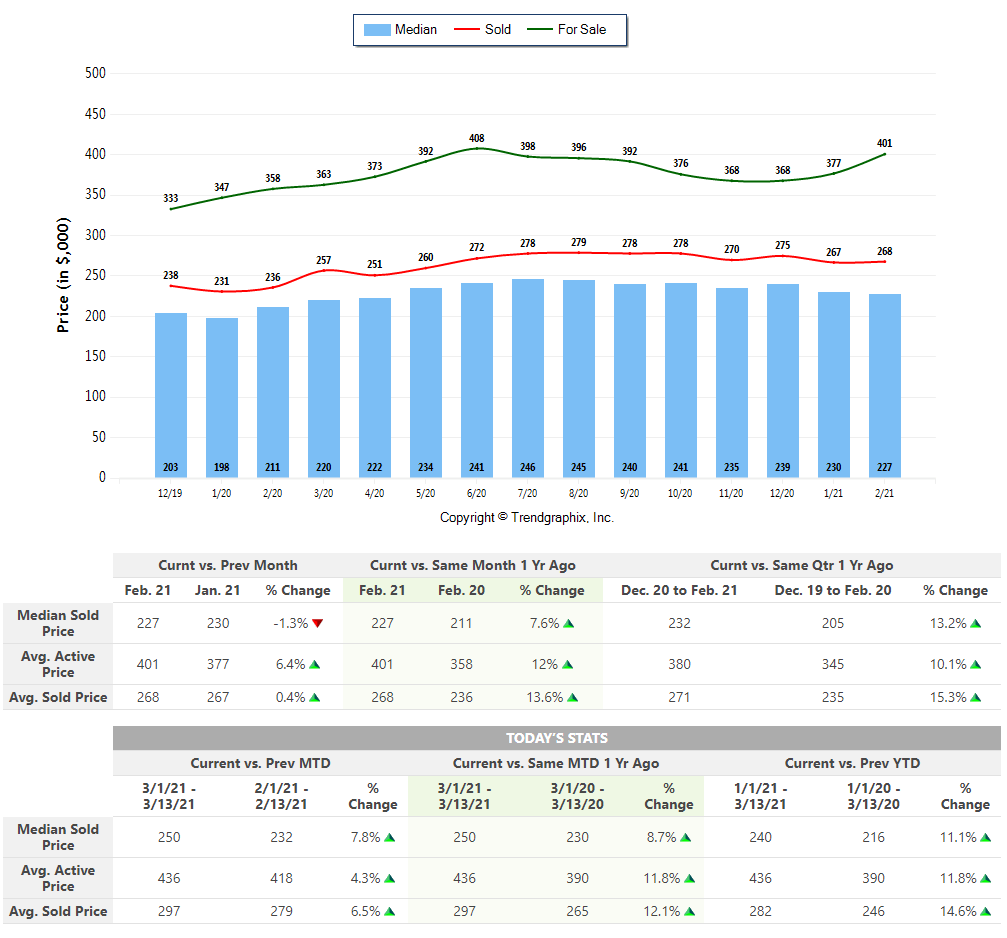
💲Central Ohio Housing Prices
The Median Sold Price trend is Neutral.* The Median Sold Price for February 2021 was $227k.
• Down 1.3% compared to January 2020
• Up 7.6% compared to February 2020
The Average For Sale Price trend is Depreciating.* The Average For Sale Price in February 2021 was $401k.
• Up 6.4% compared to January 2020
• Up 12% compared to February 2020
The Average Sold Price trend is Neutral.* The Average Sold Price in February 2021 was $268k.
• Up 0.4% compared to January 2020
• Up 13.6% compared to February 2020
*Based on 6-month trend – Appreciating/Depreciating/Neutral
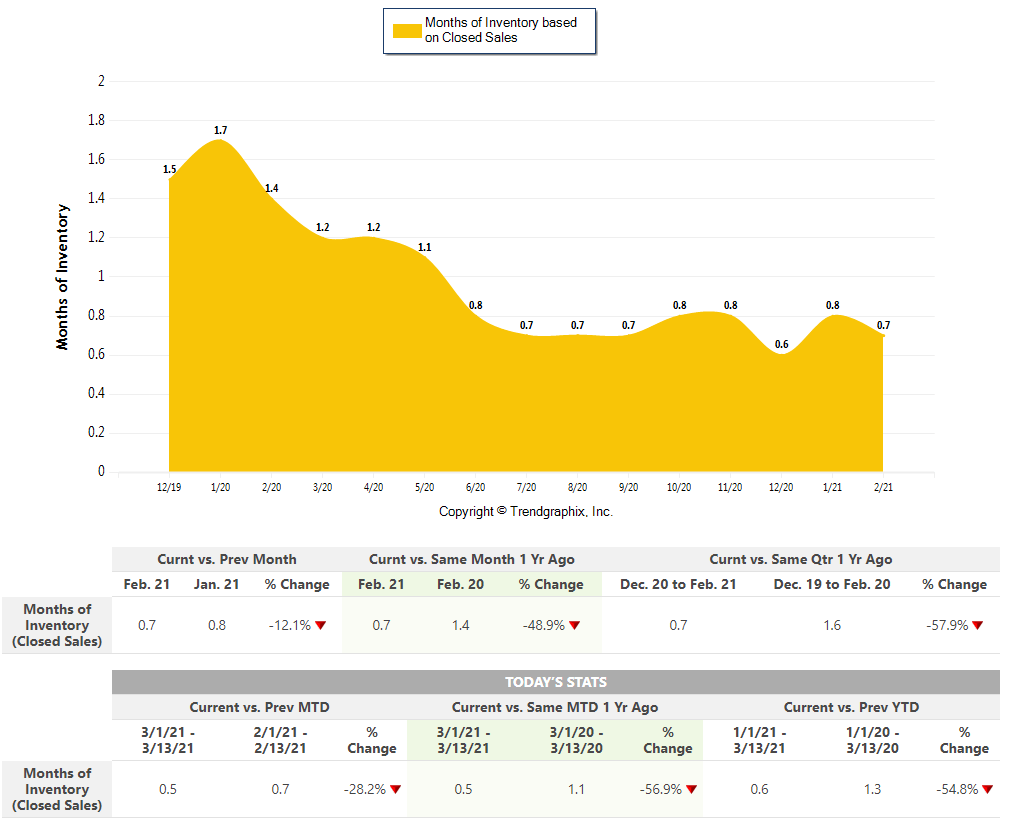
🏘️ Central Ohio Months Of Inventory
It is still a Seller’s Market* in Columbus, Ohio!!!
The Months of Inventory based on Closed Sales in February 2021 is 0.7.
• Down 12.1% compared to January 2020
• Down 48.9% compared to February 2020
*Seller’s market: less than 3 months of inventory based on closed sales
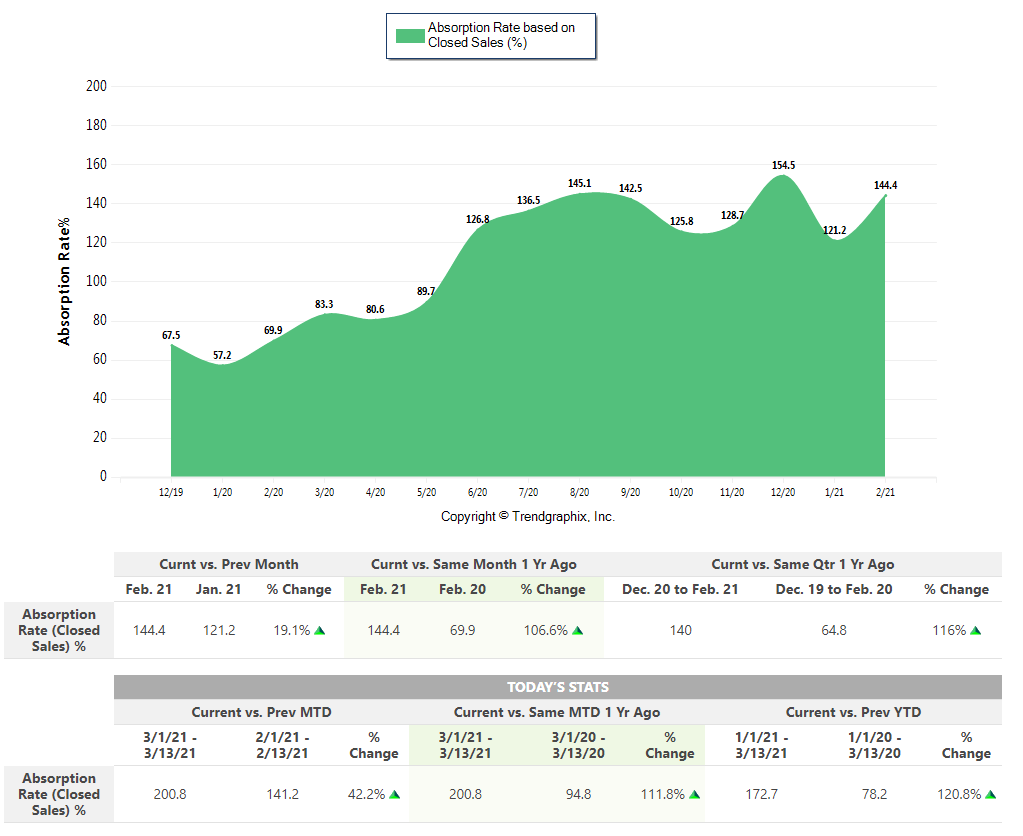
📈Central Ohio Absorption Rate
The Absorption Rate based on Closed Sales in February 2021 was 144.4
• Up 19.1% compared to January 2020
• Up 106.6% compared to February 2020
*Seller’s market: 33.33% and above based on closed sales
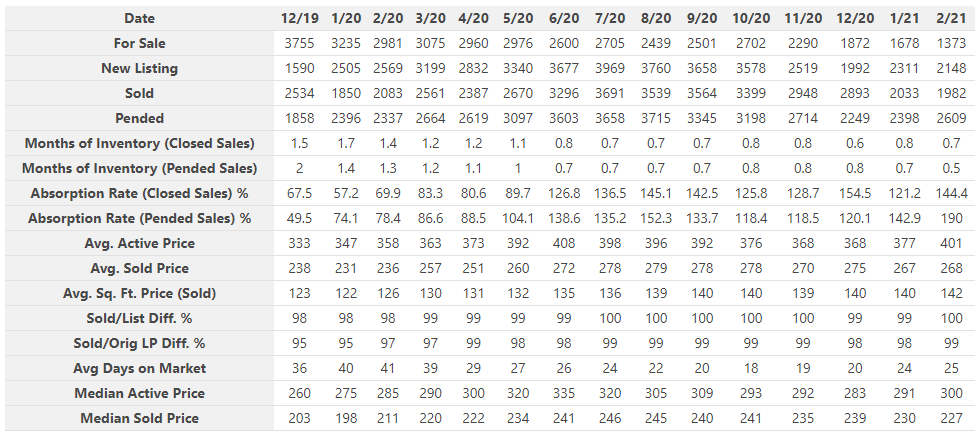
Central Ohio Housing Market Report At A Glance

Use this table to quickly see how the Columbus, Ohio area real estate market is doing.
Central Ohio Home Sellers
As per usual, this past winter has remained a strong sellers’ market. However, coming into spring and summer, who knows what the market will do next. Remember, market inventory is still extremely low, so if you’re thinking about selling, contact us! There are plenty of buyers out there in search of a home.
Housing inventory is still incredibly low, and Central Ohio needs listings! If you have a home in the Columbus area you are looking to list, PLEASE call or text Realtor Rita Boswell at 614-830-9767.
Get Your Home’s Value Instantly See What Buyers Are Searching ForQuestions about the home selling process? Check out our Seller FAQ section.
Please Note: Market conditions vary between neighborhoods and price points. Call or text Columbus Realtor Rita Boswell at 614-830-9767 to learn more about market conditions in your specific community.
Columbus OH Home Buyers
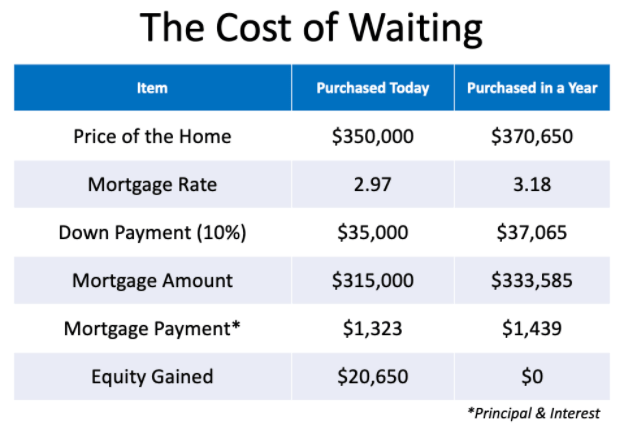
Even though it’s a seller’s market, interest rates are predicted to stay low, giving home buyers more purchasing power. As well, home values are still expected to increase over the coming years, making purchasing a home right now a great investment.
It may seem like a good idea to try to wait out market conditions rather than buy right now, but the low inventory situation is not likely to change meaningfully any time soon. Meanwhile, rates and home prices are likely to continue to go up. Rising rates will eat away at buyers’ purchasing power. Here’s a breakdown of how much it could cost you to wait:
If you’re thinking about buying a home, call or text the Rita Boswell Group at 614-830-9767. We have top-of-the-line Buyer’s Agents who can find your dream home, even in this difficult market. The spring can sometimes be a great time to buy a home. So, if that sounds like something you would like to do, it’s a good idea to start getting ready now.
Free Guide: 15 Ways To WIN Your Dream Home In This Competitive Market Browse Price Reduced Homes In Central OhioOne of the first steps in buying a home is getting pre-approved. Connect with a mortgage professional to get started with pre-approval.
Browse Today’s Newest ListingsAbout Central Ohio Real Estate Market Reports
“At the Rita Boswell Group, our goal is to provide home buyers and sellers with the most recent, in-depth market information possible.
Our report is based on data supplied by the Columbus Board of Realtors or its MLS. Information is deemed reliable but not guaranteed. Specific data points provided above may be adjusted, which will be reflected in future reports.
Our Central Ohio real estate market reports cover the counties of Franklin, Delaware, Fairfield, Licking, Madison, Pickaway, and Union. For market information on a specific community, contact Realtor Rita Boswell at 614-830-9767.
Get Your Local Market Snapshot
See property values, inventory, market data, and demographics for your local Central Ohio community.
Your Local Market Snapshot