In May, Months of Inventory increased slightly to 0.8. Since this is under 3, it’s still a seller’s market. The number of new listings went up 17.3% compared to May. While the number of new listings finally outpaced the number of pending homes, only time will tell if this is a new trend that could increase overall inventory levels in Central Ohio.
Persistent low inventory and the house-hunting season explain why prices continue to increase. For Sale prices came down slightly, but are still considerably higher than Sold prices. This might indicate that sellers are not adjusting their list prices for higher interest rates, forcing them to lower prices in order to sell.
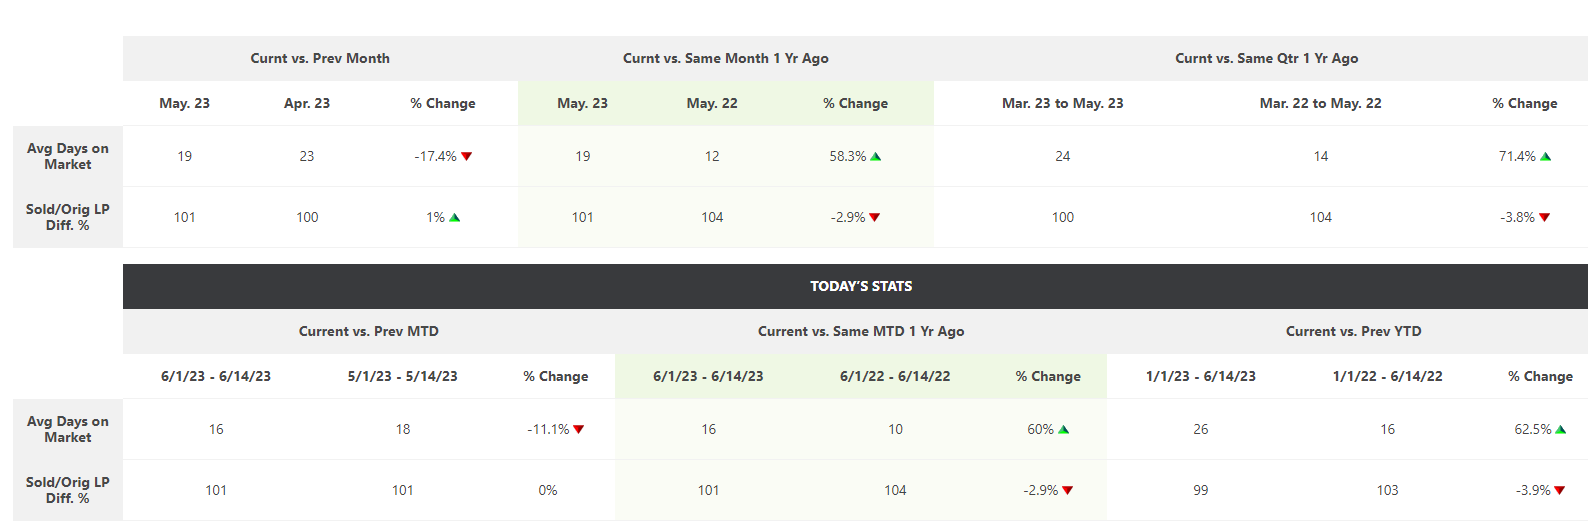
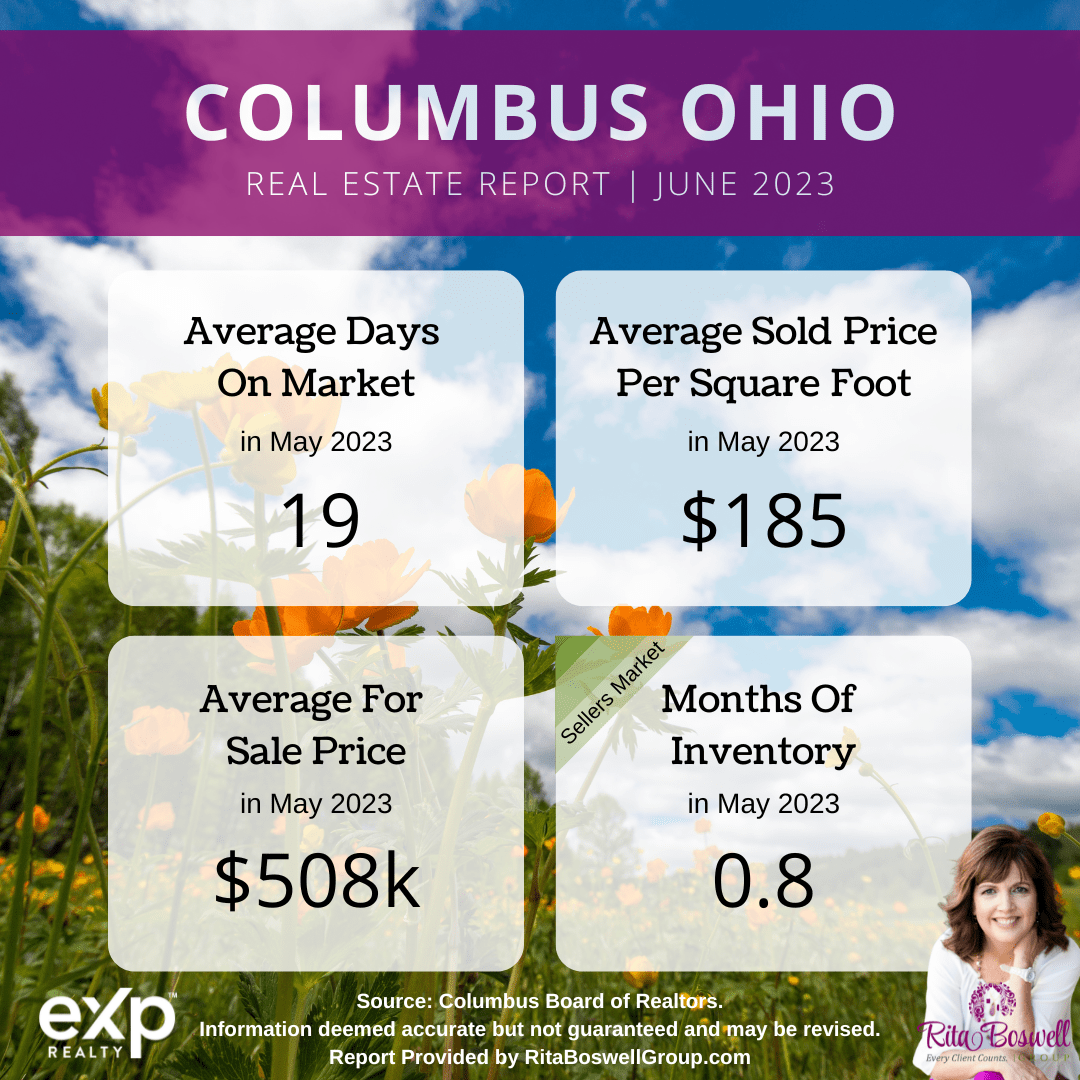
Homes do continue to sell relatively quickly at only 19 days on average. That’s longer than last year at this time, but it is still historically fast and more normal than the last couple of years.
Continue reading to see how the Columbus, Ohio housing market is performing. “Today’s Stats” are also included so you can see how things have changed as of the time of writing (June 15th, 2023).
If you need to buy or sell a home, please contact us at 614-830-9767. You can always begin your home-buying journey online from the comfort of your home at RitaBoswellGroup.com. You can even see sold homes on our site!
- 🏘️ Central Ohio Homes For Sale, Listed, Sold, & Pending
- 📐Central Ohio Average Price Per Square Foot
- 📉Central Ohio Days on Market
- 💲Central Ohio Housing Prices
- 🏘️ Central Ohio Months Of Inventory
- 📈Central Ohio Absorption Rate
- Central Ohio Housing Market Report At A Glance
- Central Ohio Home Sellers
- Columbus OH Home Buyers
- Get Your Local Market Snapshot
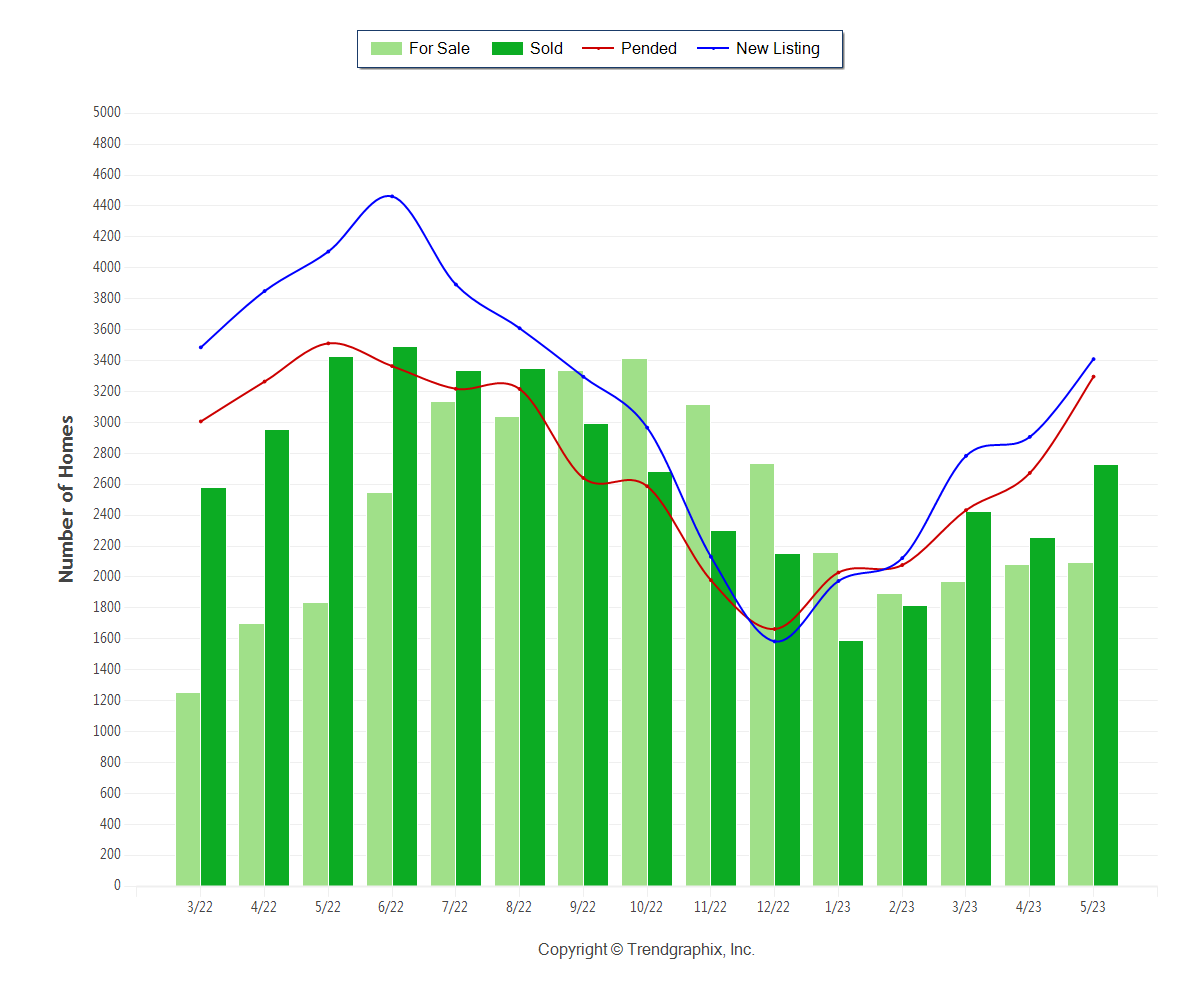
🏘️ Central Ohio Homes For Sale, Listed, Sold, & Pending
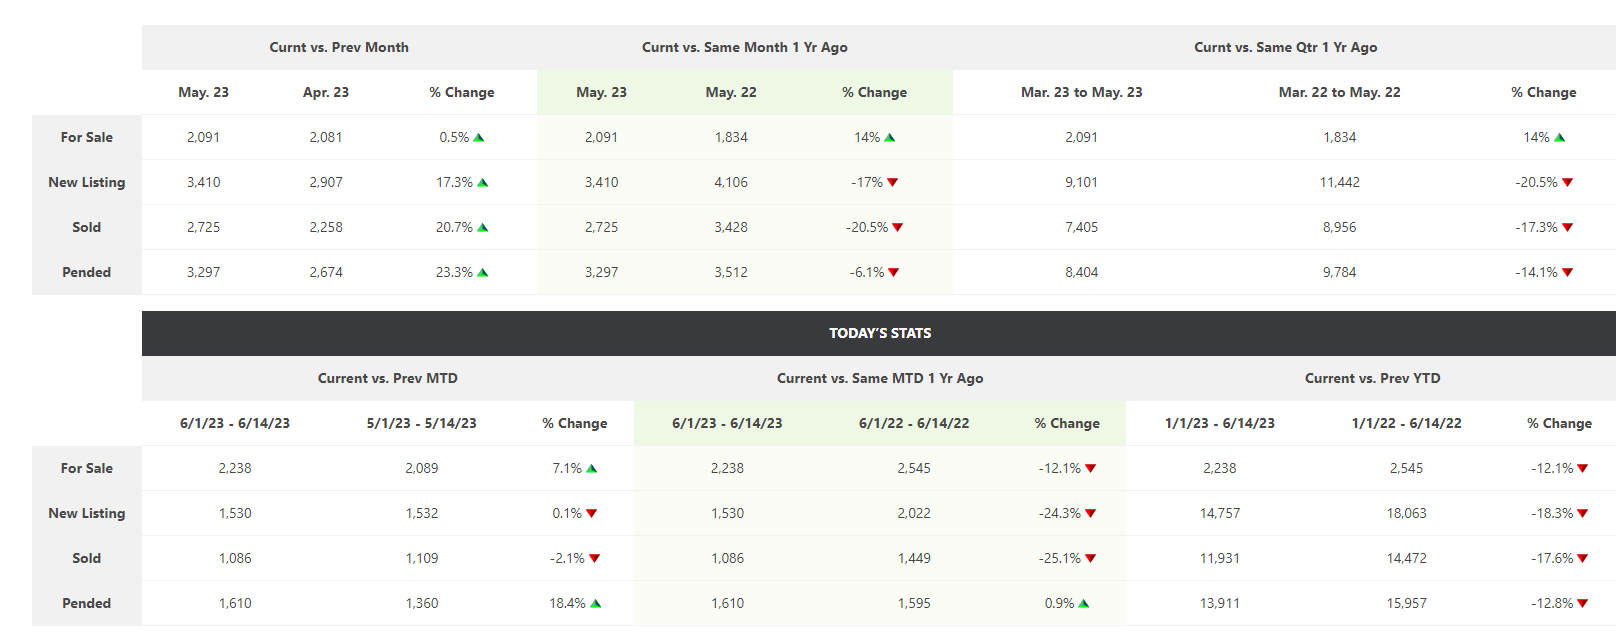
The number of Homes For Sale in May 2023 was 2091 units.
• Up 0.5% compared to April 2023
• Up 14% compared to May 2022
The number of Homes Listed in May 2023 was 3410 units.
• Up 17.3% compared to April 2023
• Down 17% compared to May 2022
The number of Homes Closed in May 2023 was 2725 units.
• Up 20.7% compared to April 2023
• Down 20.5% compared to May 2022
The number of Homes Placed Under Contract in May 2023 was 3297 units.
• Up 23.2% compared to April 2023
• Down 6.1% compared to May 2022
📐Central Ohio Average Price Per Square Foot
The Average Price per Square Foot on Sold homes trend is Appreciating.* In May 2023 the Average Price Per Square Foot was $185.
• Up 1.6% compared to April 2023
• Up 2.8% compared to May 2022
*Based on 6-month trend – Appreciating/Depreciating/Neutral
Quick Guide: Average Price Per Square Footage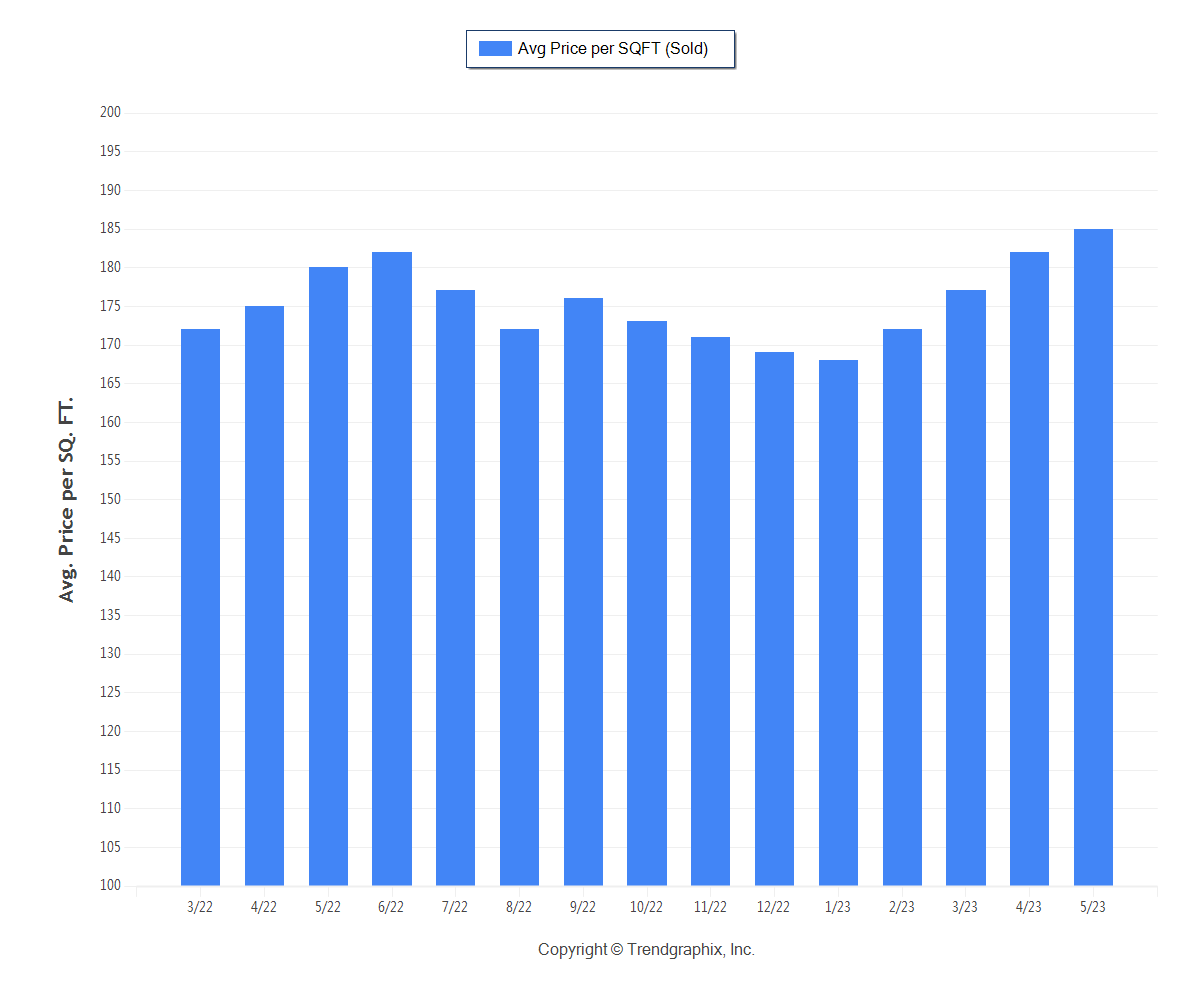

📉Central Ohio Days on Market
The average Days On Market trend in the Columbus area is Falling.*
The Average Days on Market in May 2023 was 19 days.
• Down 17.4% compared to April 2023
• Up 58.3% compared to May 2022
The Sold/Original List Price Ratio Remains Rising* at 101% for May 2023.
• Up 1% compared to April 2023
• Down 2.9% compared to May 2022
*Based on 6-month trend – Rising/Falling/Remains Steady
Quick Guide: Average Days On Market & Sold/List Price %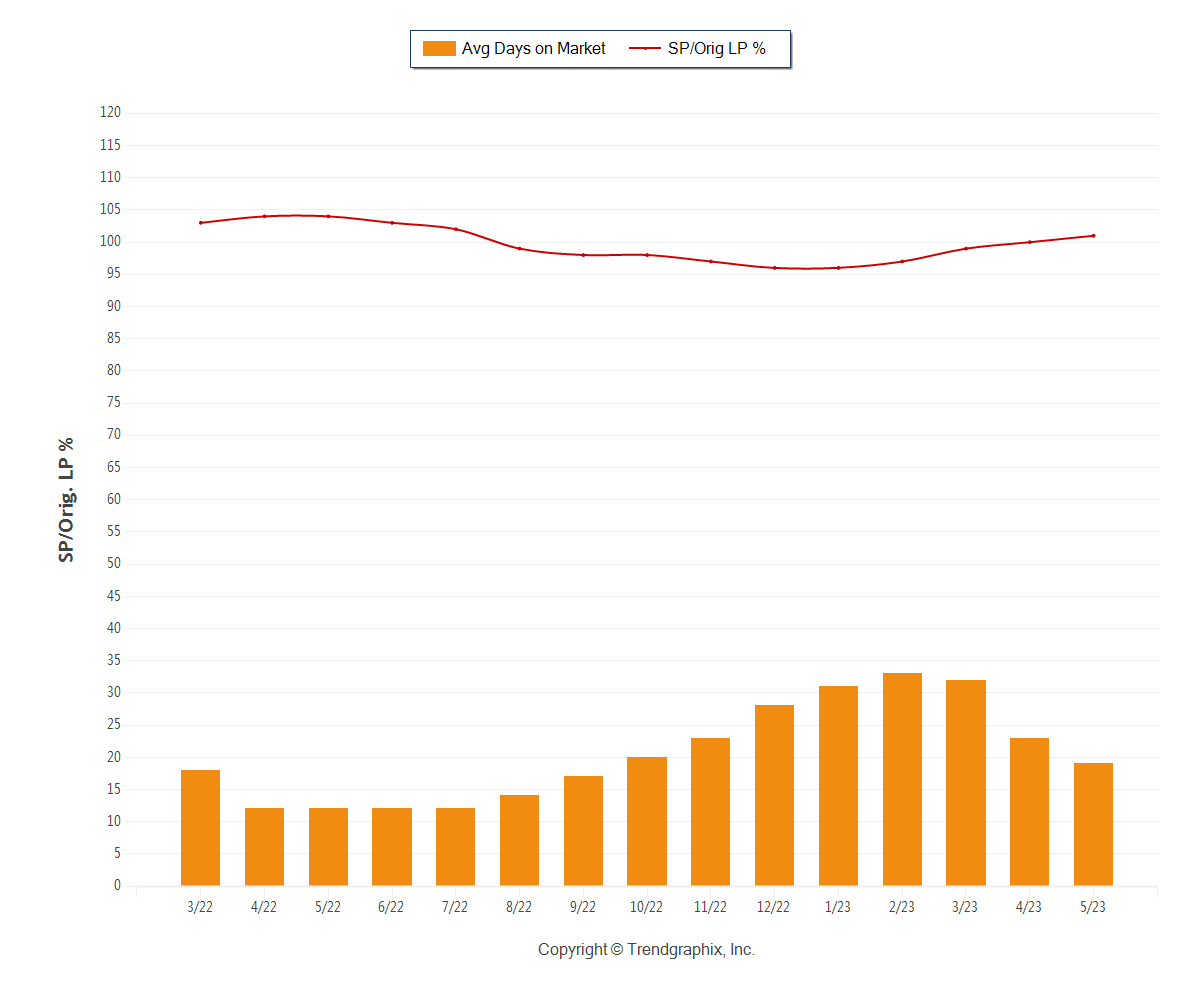
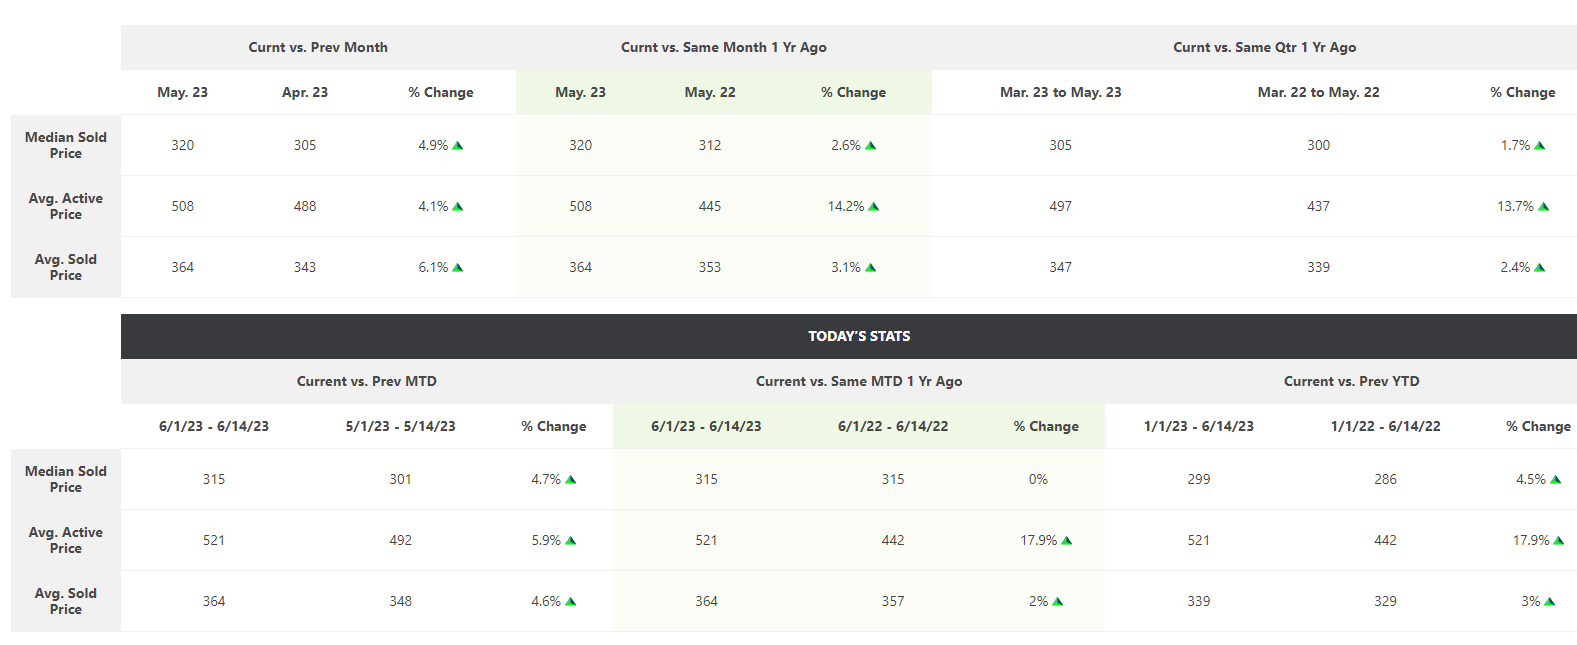
💲Central Ohio Housing Prices
The Median Sold Price trend is Appreciating.* The Median Sold Price for May 2023 was $320k.
• Up 4.9% compared to April 2023
• Up 2.6% compared to May 2022
The Average For Sale Price trend is Appreciating.* The Average For Sale Price in May 2023 was $508k.
• Up 4.1% compared to April 2023
• Up 14.2% compared to May 2022
The Average Sold Price trend is Appreciating.* The Average Sold Price in May 2023 was $364k.
• Up 6.1% compared to April 2023
• Up 3.1% compared to May 2022
*Based on 6-month trend – Appreciating/Depreciating/Neutral
Quick Guide: Average Price For Sale and Sold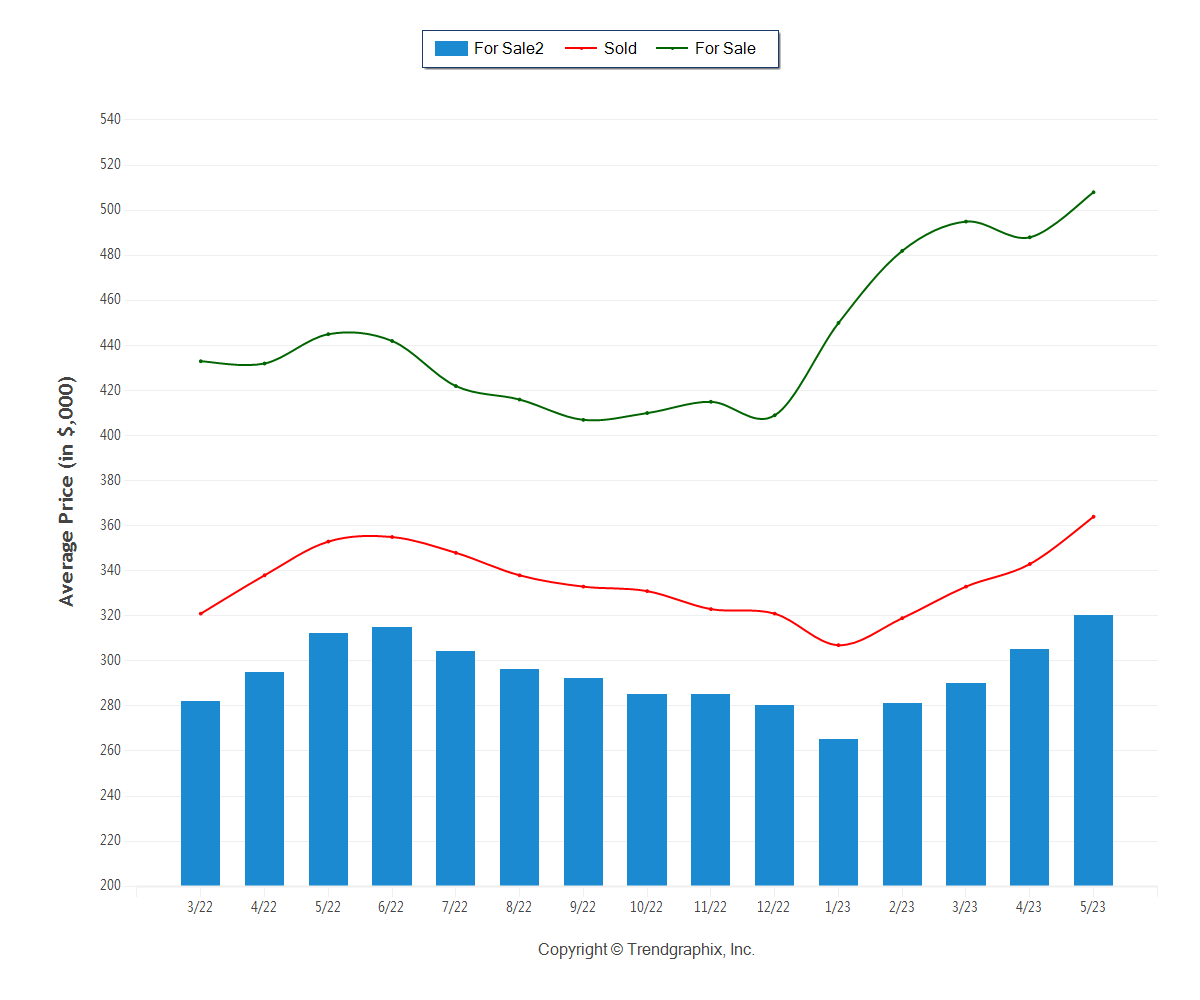
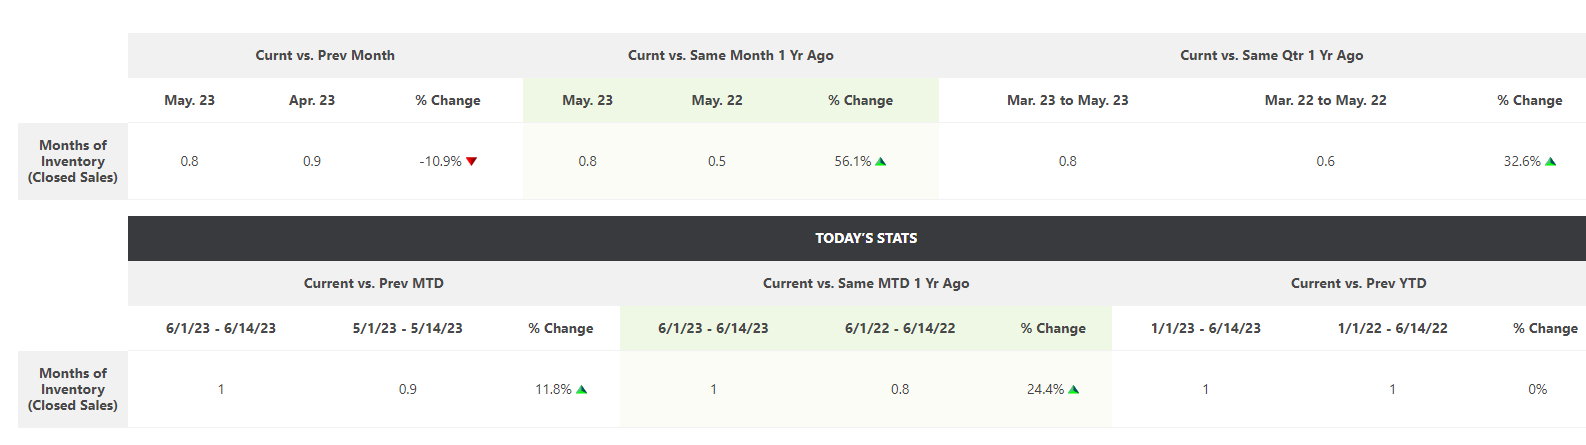
🏘️ Central Ohio Months Of Inventory
It is still a Seller’s Market* in Columbus, Ohio!!!
The Months of Inventory based on Closed Sales in May 2023 was 0.8.
• Down 10.9% compared to April 2023
• Up 56.1% compared to May 2022
*Seller’s market: less than 3 months of inventory based on closed sales
Quick Guide: Months Of Inventory | Median Price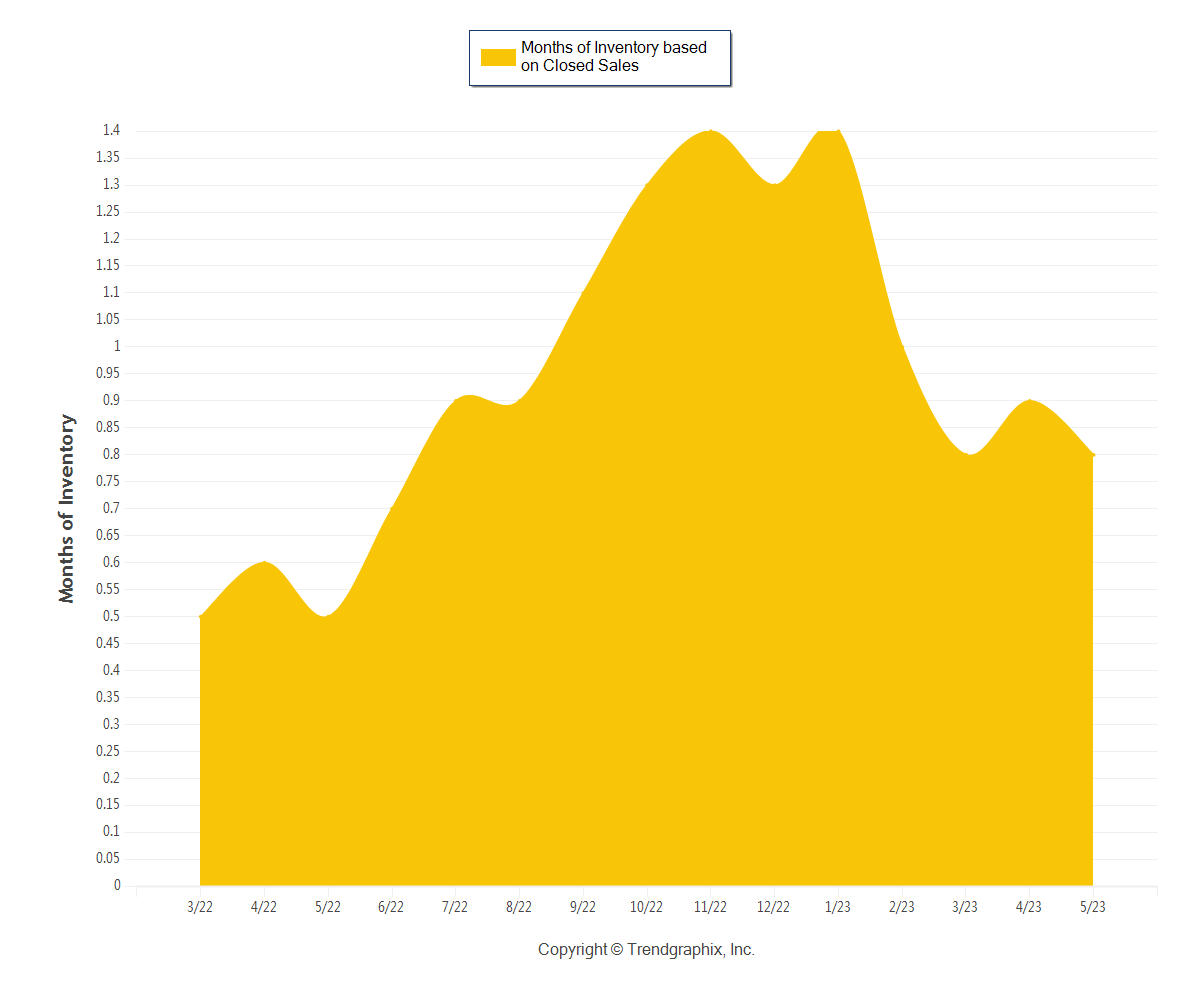
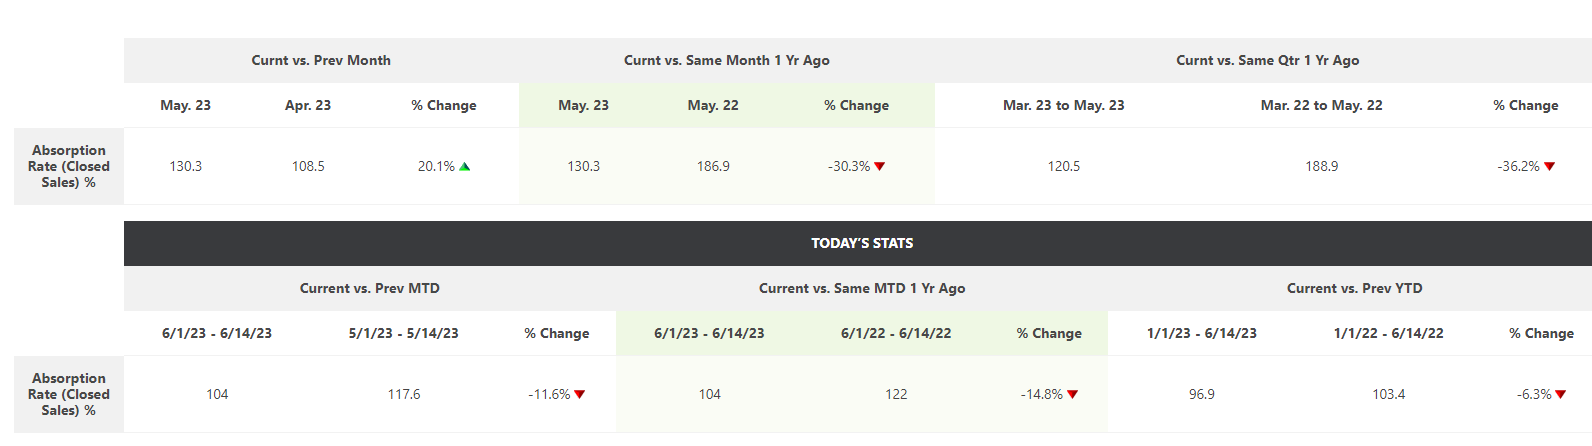
📈Central Ohio Absorption Rate
The Absorption Rate based on Closed Sales in May 2023 was 130.3.
• Up 20.1% compared to April 2023
• Down 30.3% compared to May 2022
*Seller’s market: 33.33% and above based on closed sales
Quick Guide: Absorption Rate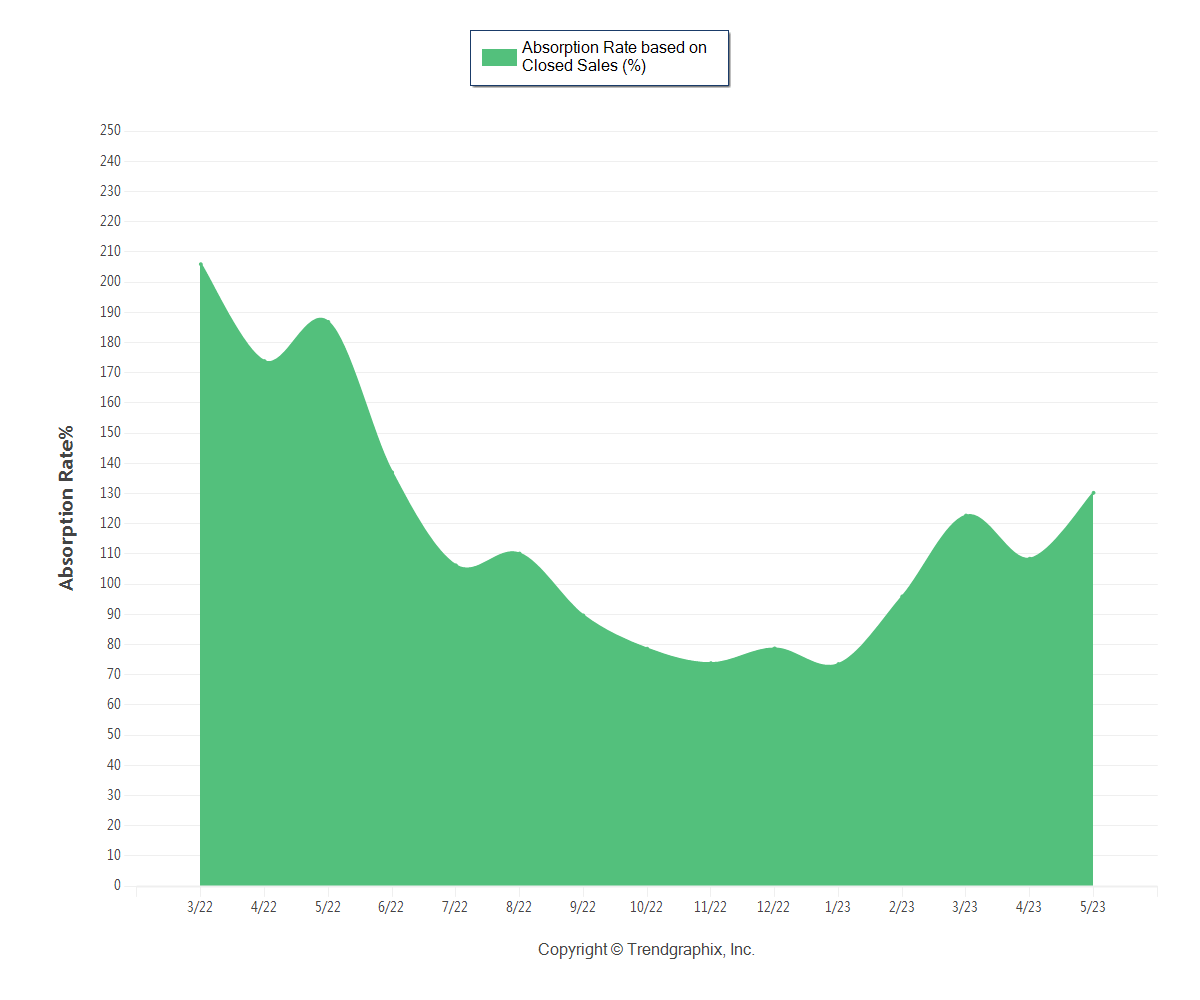
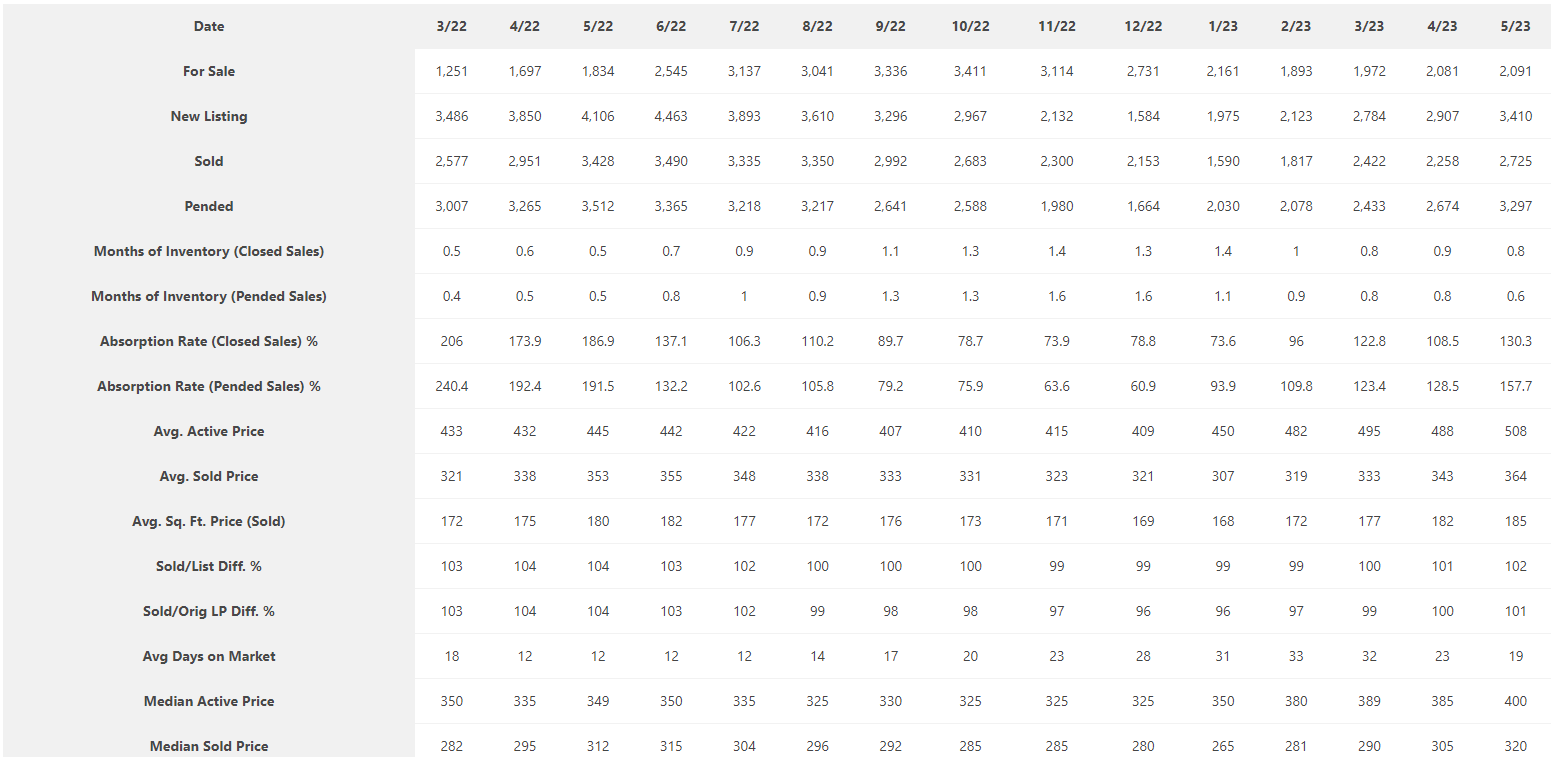
Central Ohio Housing Market Report At A Glance
Use this table to quickly see how the Columbus, Ohio area real estate market is doing.
Find Housing Reports From Columbus REALTORS®
Central Ohio Home Sellers
Inventory and rates are putting the market in a tug of war. Higher home prices and higher interest rates are making it difficult for buyers who find themselves priced out. It’s still a great time to sell your home in Columbus, but it’s not as competitive as last year. As mentioned at the beginning of this report, some sellers are overpricing their homes because they are not taking the changing market into consideration.
If you’re selling your home in 2023, consider the following:
- Don’t overprice your home. It’s important to price your home correctly or even a little low to induce the “auction effect.” If you need to reduce the price, don’t wait to do so. Read: When To Reduce The Price
- Make your home as close to move-in ready as possible. Buyers prefer move-in ready and tend to overestimate the cost of repairs.
- Consider offering Seller Credits or Buy Downs to help home buyers deal with higher rates
Read: 5 Tips To Sell Your Home Over Asking Price
If all that sounds like a big pain, get our easy, fast, and fair cash offer to sell quickly without the hassle of selling traditionally.
Get An Easy Cash Offer For Your Home Check Your Home’s Value InstantlyQuestions about the home selling process? Check out our Seller FAQ section.
Please Note: Market conditions vary between neighborhoods and price points. Call or text Columbus Realtor Rita Boswell at 614-830-9767 to learn more or to request a Neighborhood Report, which provides in-depth data for your specific neighborhood.
Columbus OH Home Buyers
While the market is normalizing, inventory remains too low. But, despite higher rates and higher home prices, it still makes more sense to own than to rent. Rents have increased just like everything else.
Consider this, according to Rent Cafe, the average rent in Columbus, Ohio is $1,183 and the average apartment size in Columbus is only 881 square feet. That’s $14,196 a year for an apartment less than 1k square feet. Over a 30-year span, that comes out to $425,880 for something you don’t own.
If you’re still renting, look for opportunities in the market such as “stale” listings, price-reduced homes, new home opportunities, down payment assistance, and fixer-uppers. Start building your own wealth instead of your landlord’s. We have many strategies to help you beat this housing market and become a homeowner.
New Paired Patio Homes Starting Under $300k!Thinking about buying a home in Central Ohio? Call or text the Rita Boswell Group at 614-830-9767. We can help you find your dream home, even in this challenging market. The market is competitive, and you definitely want a skilled agent working for you.
See Homes Coming Soon To ColumbusThe most important step in buying a home is getting pre-approved. Connect with a mortgage professional to get started with pre-approval.
Browse Today’s Newest ListingsAbout Central Ohio Real Estate Market Reports
“At the Rita Boswell Group, our goal is to provide home buyers and sellers with the most recent, in-depth local market information possible.
Our report is based on data supplied by the Columbus Board of Realtors or its MLS. Information is deemed reliable but not guaranteed. Specific data points provided above may be adjusted, which will be reflected in future reports.
*Our Central Ohio real estate market reports cover the counties of Franklin, Delaware, Fairfield, Licking, Madison, Pickaway, and Union. For market information on a specific community or for the entire Columbus MLS, contact Realtor Rita Boswell at 614-830-9767.
Get Your Local Market Snapshot
See property values, inventory, market data, and demographics for your local Central Ohio community.
Your Local Market Snapshot