Summer is almost over, and like clockwork, the real estate market begins to slow down.
As expected, home prices are coming down slightly, and homes took a little longer to sell in August compared to July.
Keep reading for the full report and to view trends.
- 🏘️ Central Ohio Homes For Sale, Listed, Sold, & Pending
- 📐Central Ohio Average Price Per Square Foot
- 📉Central Ohio Days on Market
- 💲Central Ohio Housing Prices
- 🏘️ Central Ohio Months Of Inventory
- 📈Central Ohio Absorption Rate
- Central Ohio Housing Market Report At A Glance
- Central Ohio Home Sellers
- Columbus OH Home Buyers
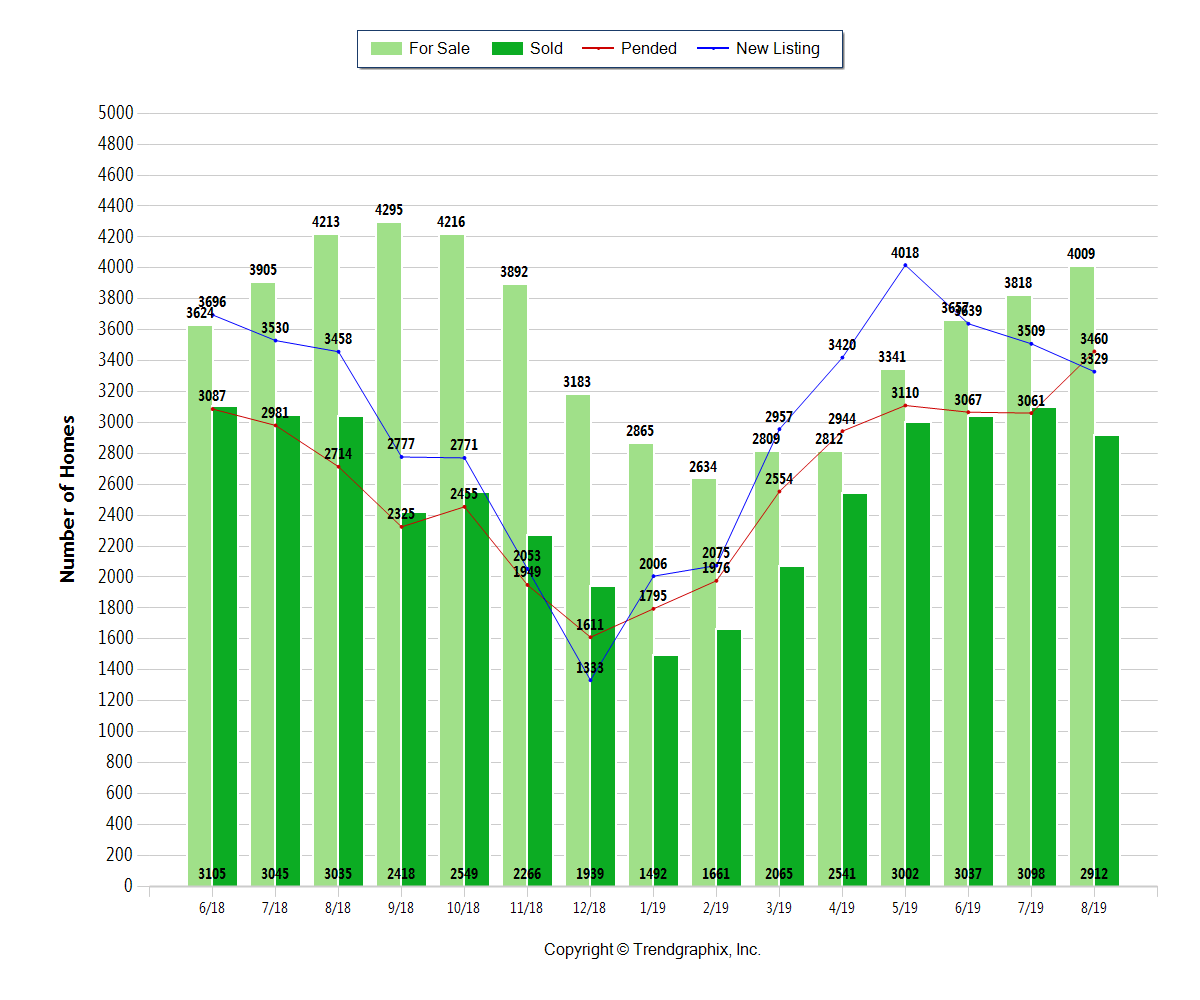
🏘️ Central Ohio Homes For Sale, Listed, Sold, & Pending
The number of Homes For Sale in August 2019 was 4881 units.
•  Up 4.9% compared to July 2019
•  Down 5.1% compared to August 2018
The number of Homes Listed in August 2019 was 3791 units.
• Down 5.5% compared to July 2019
• Down 3.9% compared to August 2018
The number of Homes Closed in August 2019 was 3267 units.
• Down 5.7% compared to July 2019
• Down 3.5% compared to August 2018
The number of Homes Placed Under Contract in August 2019 was 3905 units.
• Up 13.2% compared to July 2019
• Up 28.2% compared to August 2018
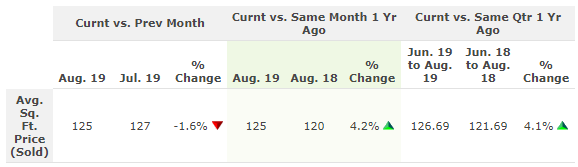
📐Central Ohio Average Price Per Square Foot
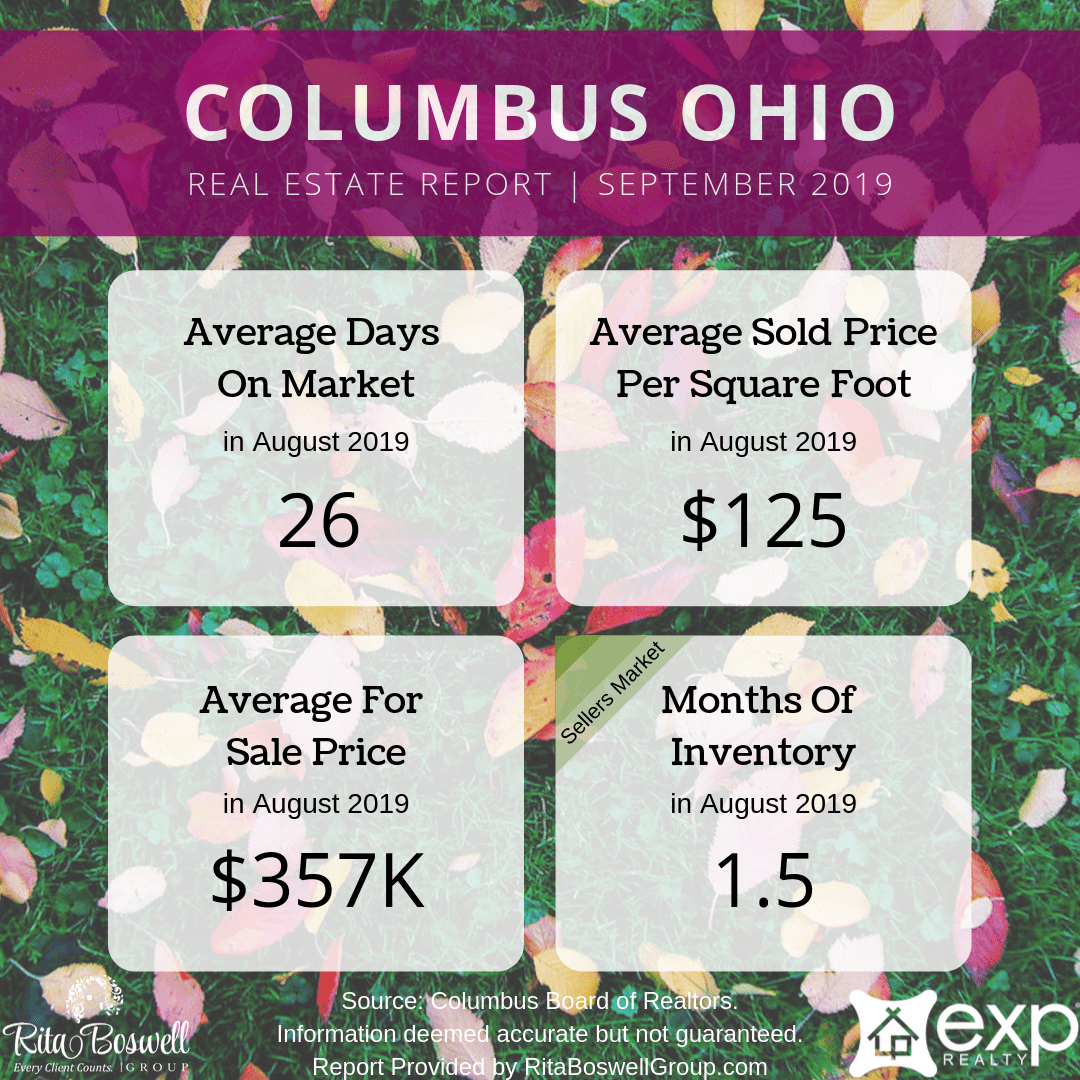
The Average Price per Square Foot on Sold homes trend is Neutral.* In August 2019 the Average Price Per Square Foot was $125.
• Down 1.6% compared to July 2019
• Up 4.2% compared to August 2018
*Based on 6 month trend – Appreciating/Depreciating/Neutral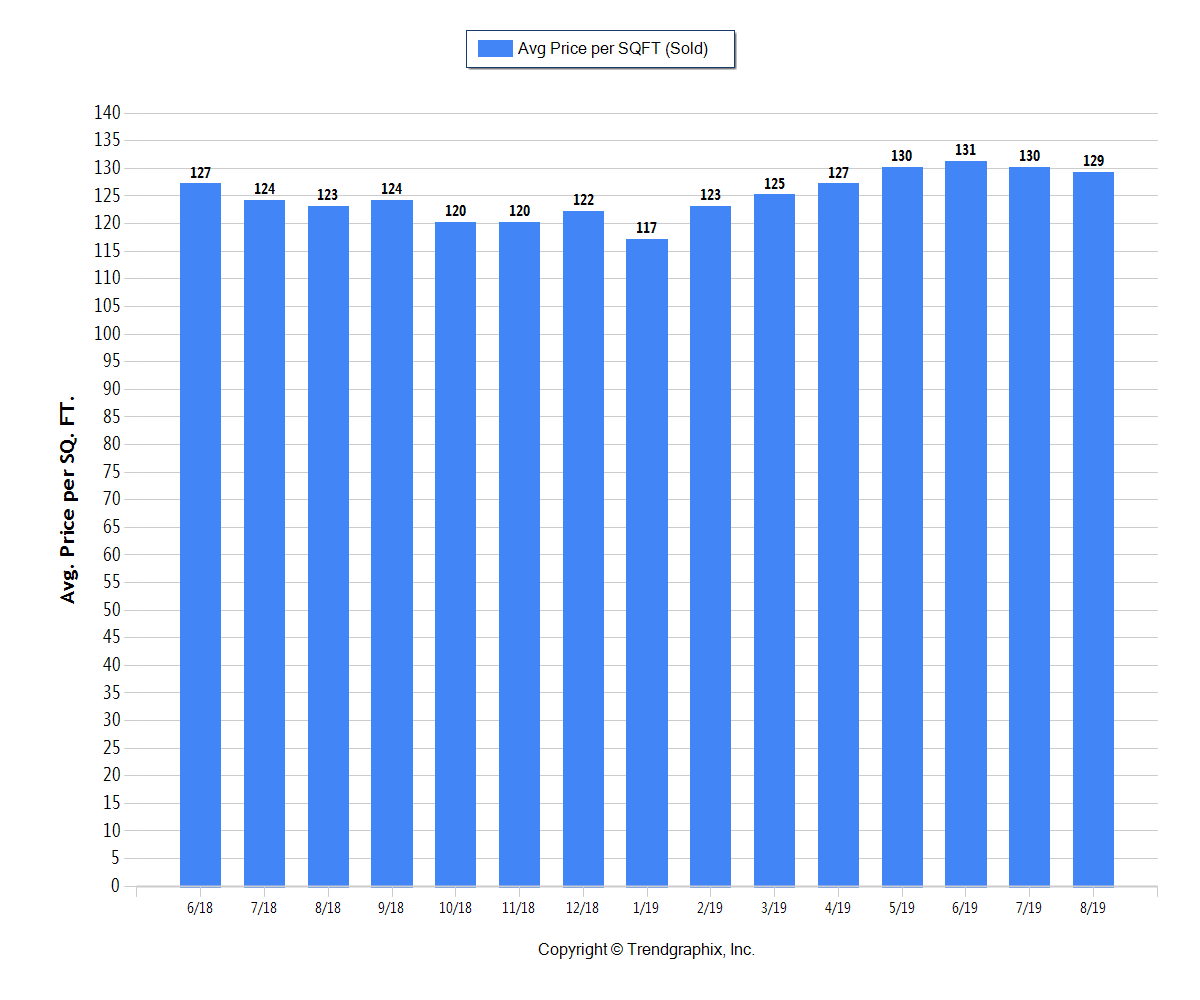
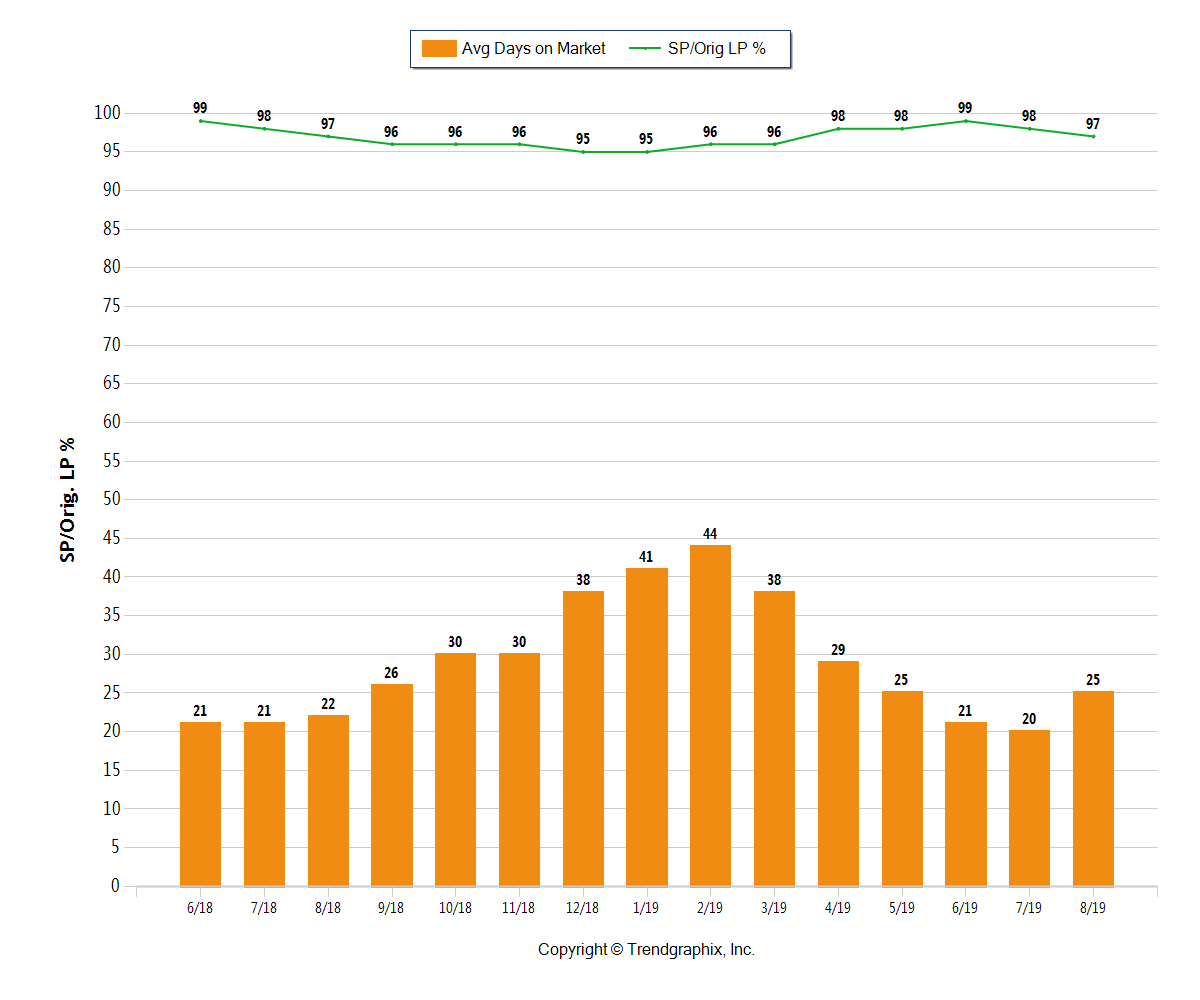
📉Central Ohio Days on Market
The average Days On Market trend in the Columbus area is Steady.*
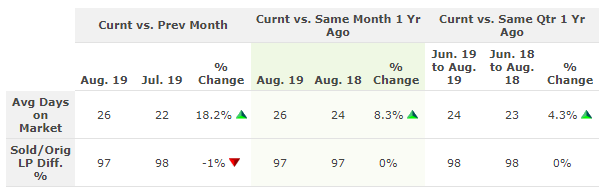
The Average Days on Market in August 2019 was 26 days.
• Up 18.2% compared to July 2019
• Up 8.3% compared to August 2018
The Sold/Original List Price Ratio is Steady* at 97% for August 2019.
• Down 1% compared to July 2019
• 0% compared to August 2018
*Based on 6 month trend – Rising/Falling/Remains Steady
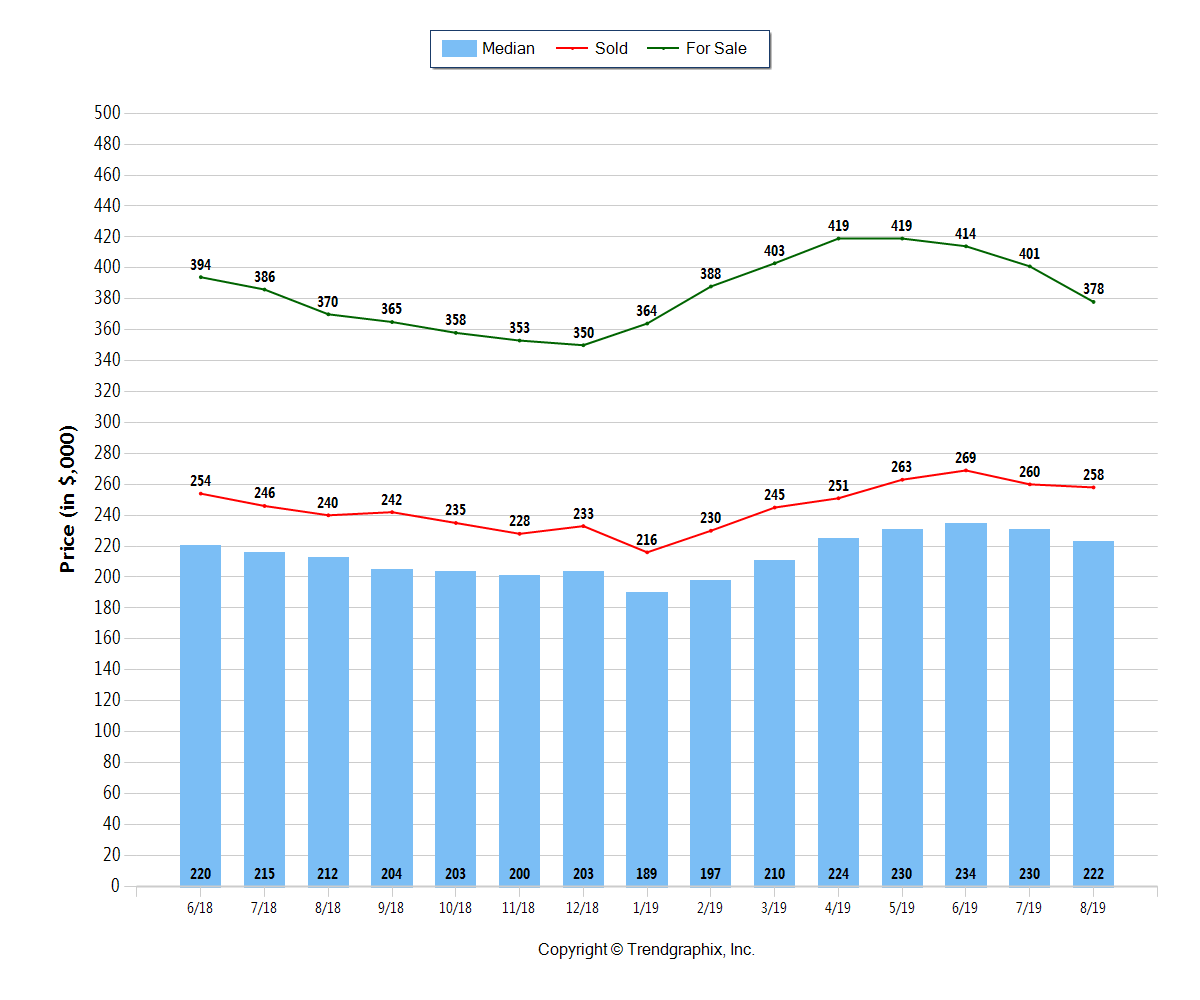
💲Central Ohio Housing Prices
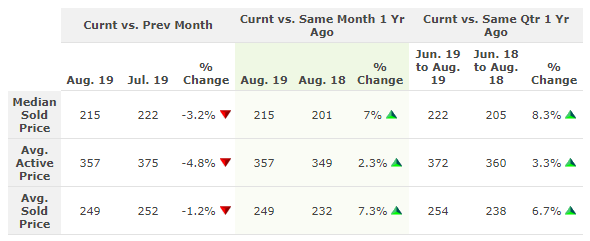
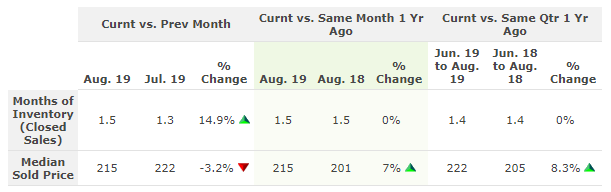
The Median Sold Price trend is Neutral* The Median Sold Price for August 2019 was $215k.
• Down 3.2% compared to July 2019
• Up 7% compared to August 2018
The Average For Sale Price trend is Depreciating.* The Average For Sale Price in August 2019 was $357k.
• Down 4.8% compared to July 2019
• Up 2.3% compared to August 2018
The Average Sold Price trend is Neutral.* The Average Sold Price in August 2019 was $249k.
• Down 1.2% compared to July 2019
• Up 7.3% compared to August 2018
*Based on 6 month trend – Appreciating/Depreciating/Neutral
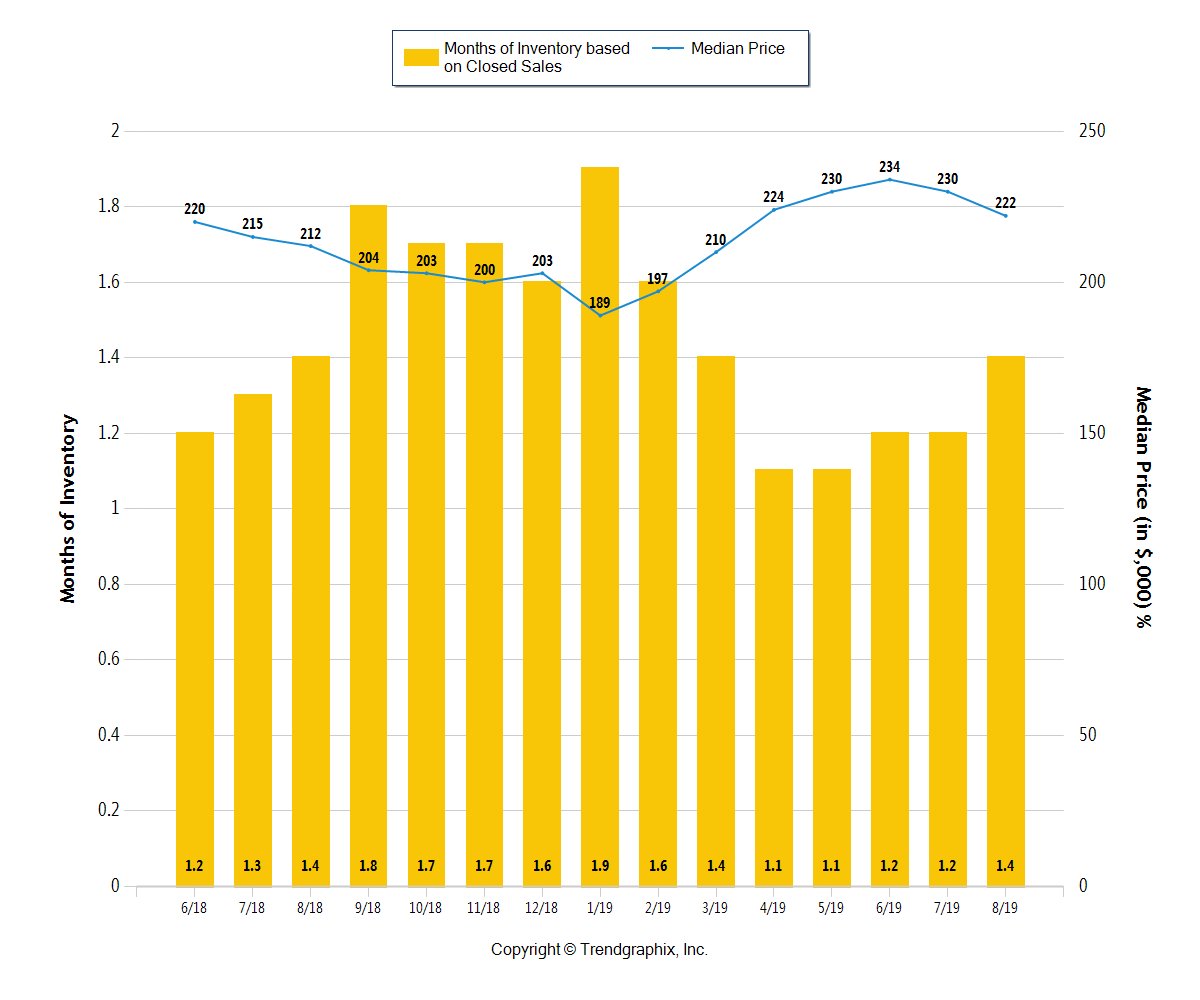
🏘️ Central Ohio Months Of Inventory
It’s still a Seller’s Market* in Columbus, Ohio!
The Months of Inventory based on Closed Sales in August 2019 was 1.5.
• Up 14.9% compared to July 2019
• 0% compared to August 2018
*Seller’s market: less than 3 months of inventory based on closed sales
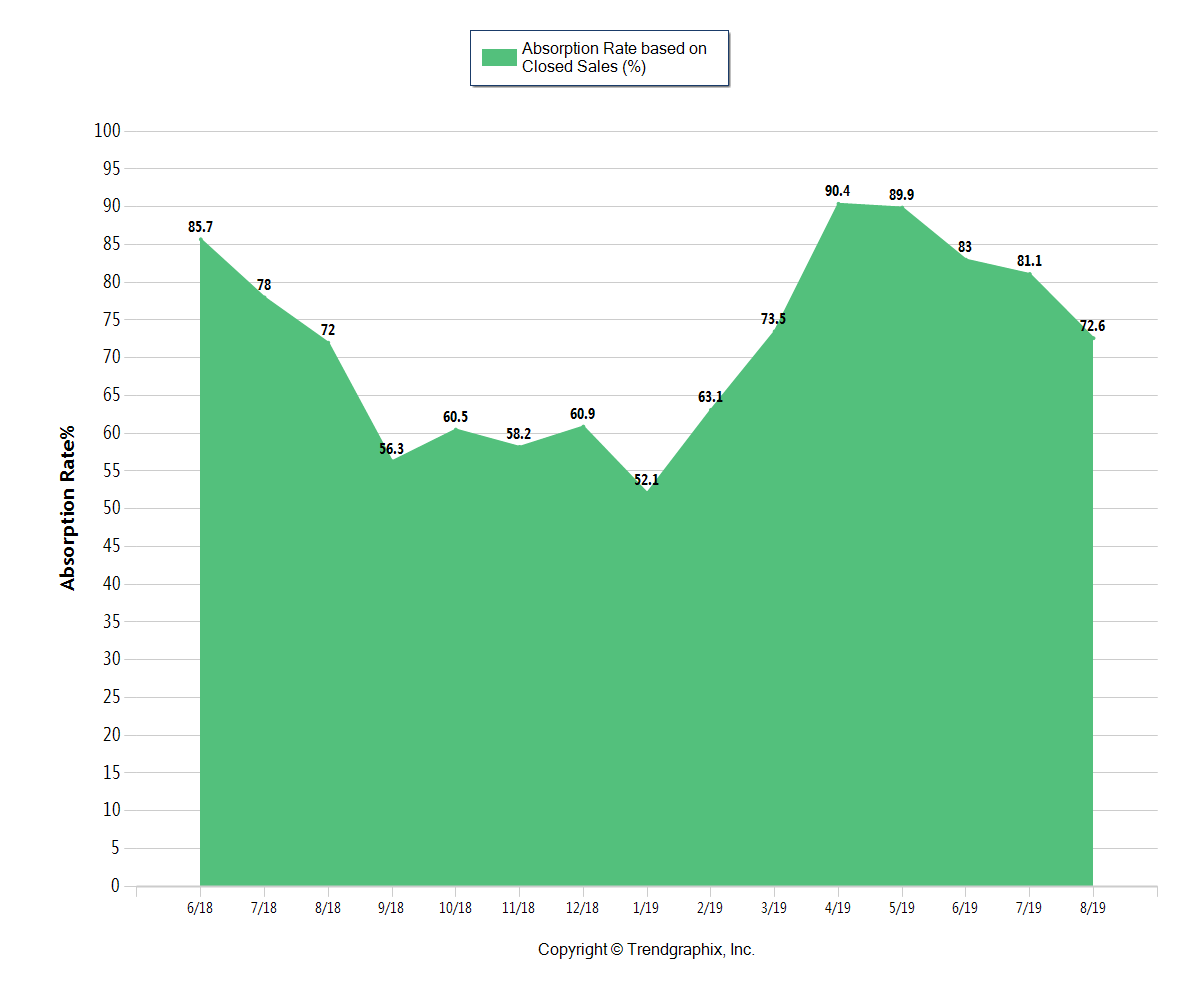
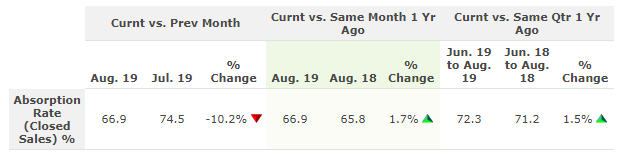
📈Central Ohio Absorption Rate
The Absorption Rate based on Closed Sales in August 2019 was 66.9.
• Down 10.2% compared to July 2019
• Up 1.7% compared to August 2018
*Seller’s market: 33.33% and above based on closed sales
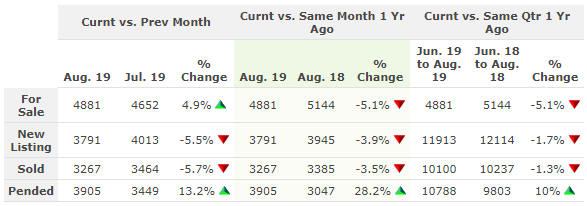
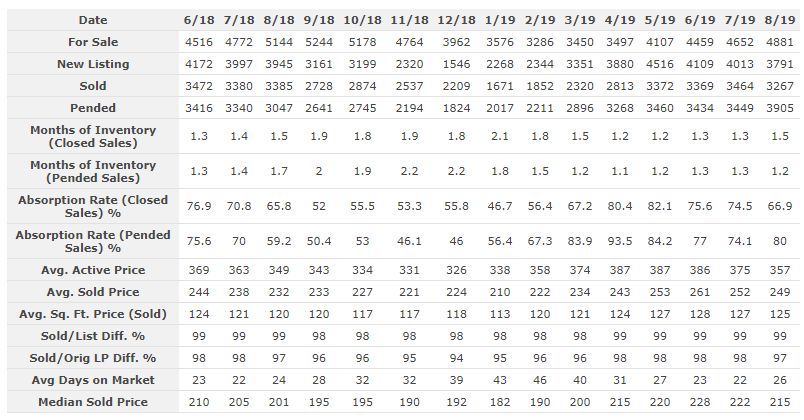
Central Ohio Housing Market Report At A Glance
Use this table to quickly see how the Columbus, Ohio area real estate market is doing.
Central Ohio Home Sellers
If you’re thinking about selling your home soon, it’s a good time. We are in a seller’s market overall, so it may be the perfect time to list and sell before winter sets in. If you aren’t quite ready to sell, there are pros and cons to selling a home in the winter. You will have less competition, but home prices do tend to shift down and days on market tends to shift up. That said, a real estate agent who specialized in selling homes quickly and profitably will be able to help you sell fast for more any time of the year.
If you have questions about the home selling process in Columbus, Ohio, check out our Seller FAQ section.
Market conditions are different from one neighborhood to another and one price point to another. Call or text Columbus Realtor Rita Boswell at 614-830-9767 to learn more about market conditions in your specific community.
Get Your Home’s Value InstantlyColumbus OH Home Buyers
Fall and winter are the best time to buy a home. So it’s a great time to start your home search. There will be fewer buyers to compete with, and homes will be on the market a little longer. This will give you a better opportunity to think about the homes you are looking at, and you may be less likely to find yourself in a hot multiple-offer situation.
It is still a seller’s market though, so make sure your financials are in order before finding the perfect home. Connect with a mortgage professional to get pre-approved. Getting pre-approved before starting your home search will save you the headache of looking for homes outside of your price range.
Use a Top Home Buying Agent to help you find homes that fit your needs and budget. Be ready to make a competitive offer when you find the right home.
Browse Today’s Newest ListingsAbout Central Ohio Real Estate Market Reports
“At the Rita Boswell Group, our goal is to provide home buyers and sellers with the most recent, in-depth market information possible.
Our report is based on data supplied by the Columbus Board of Realtors or its MLS. Information is deemed reliable but not guaranteed. Specific data points provided above may be adjusted, which will be reflected in future reports.
Our Central Ohio real estate market reports cover the counties of Franklin, Delaware, Fairfield, Licking, Madison, Pickaway, and Union. For market information on a specific community, contact Realtor Rita Boswell at 614-830-9767.”