Given the current healthcare emergency, it is difficult to know what the Columbus real estate market will do in the near future. If you need to buy or sell a home during this time, please contact us at 614-830-9767. You can always start your home search online from your home at RitaBoswellGroup.com.
Read More to see how the Columbus Ohio Real Estate Market did in February and to view trends.
- 🏘️ Central Ohio Homes For Sale, Listed, Sold, & Pending
- 📐Central Ohio Average Price Per Square Foot
- 📉Central Ohio Days on Market
- 💲Central Ohio Housing Prices
- 🏘️ Central Ohio Months Of Inventory
- 📈Central Ohio Absorption Rate
- Central Ohio Housing Market Report At A Glance
- Central Ohio Home Sellers
- Columbus OH Home Buyers
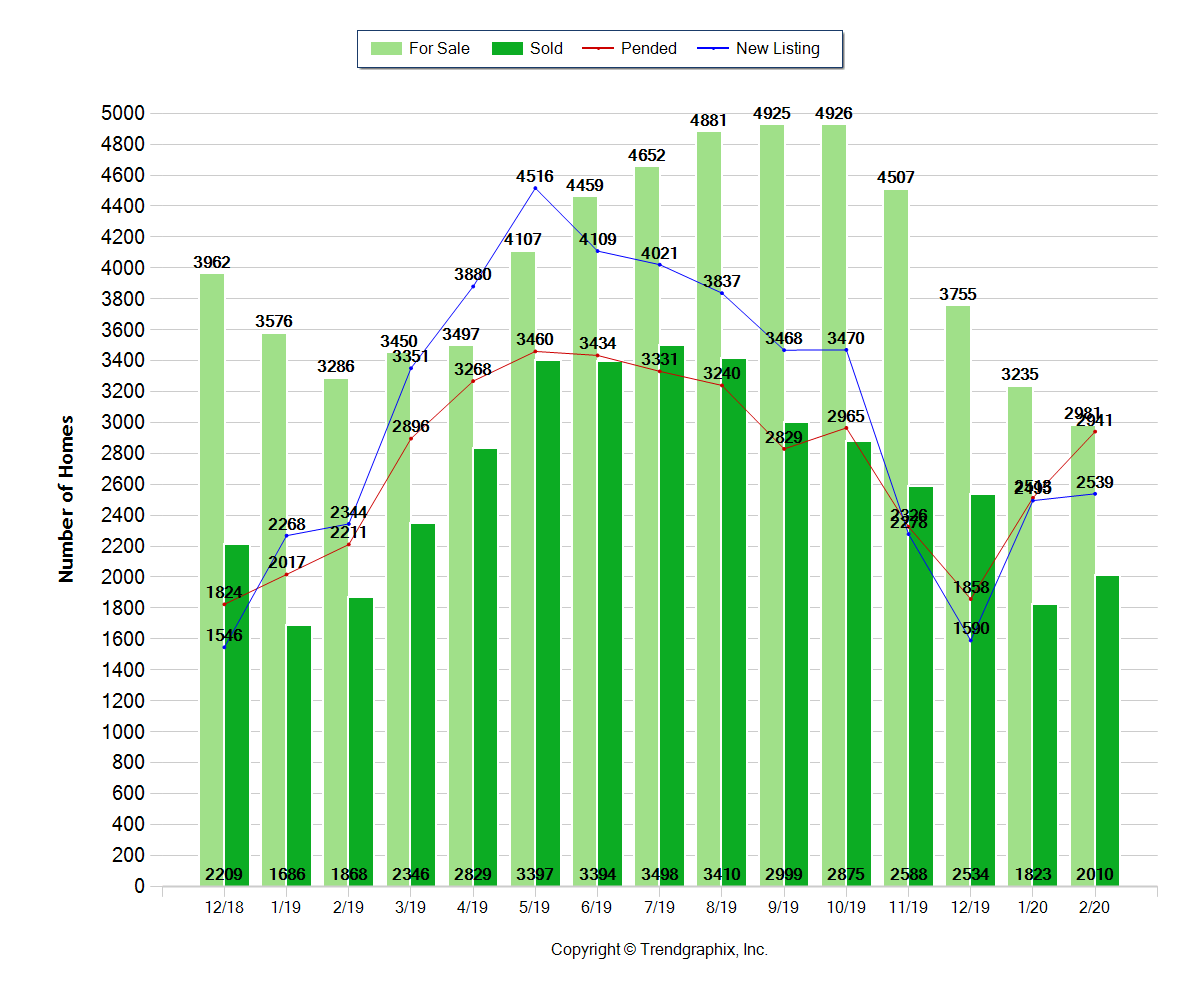
🏘️ Central Ohio Homes For Sale, Listed, Sold, & Pending
The number of Homes For Sale in February 2020 was 2981 units.
•  Down 7.9% compared to January 2020
• Down 9.3% compared to February 2019
The number of Homes Listed in February 2020 was 2539 units.
•  Up 1.8% compared to January 2020
• Up 8.3% compared to February 2019
The number of Homes Closed in February 2020 was 2010 units.
• Up 10.3% compared to January 2020
• Up 7.6% compared to February 2019
The number of Homes Placed Under Contract in February 2020 was 2941 units.
• Up 17% compared to January 2020
• Up 33% compared to February 2019

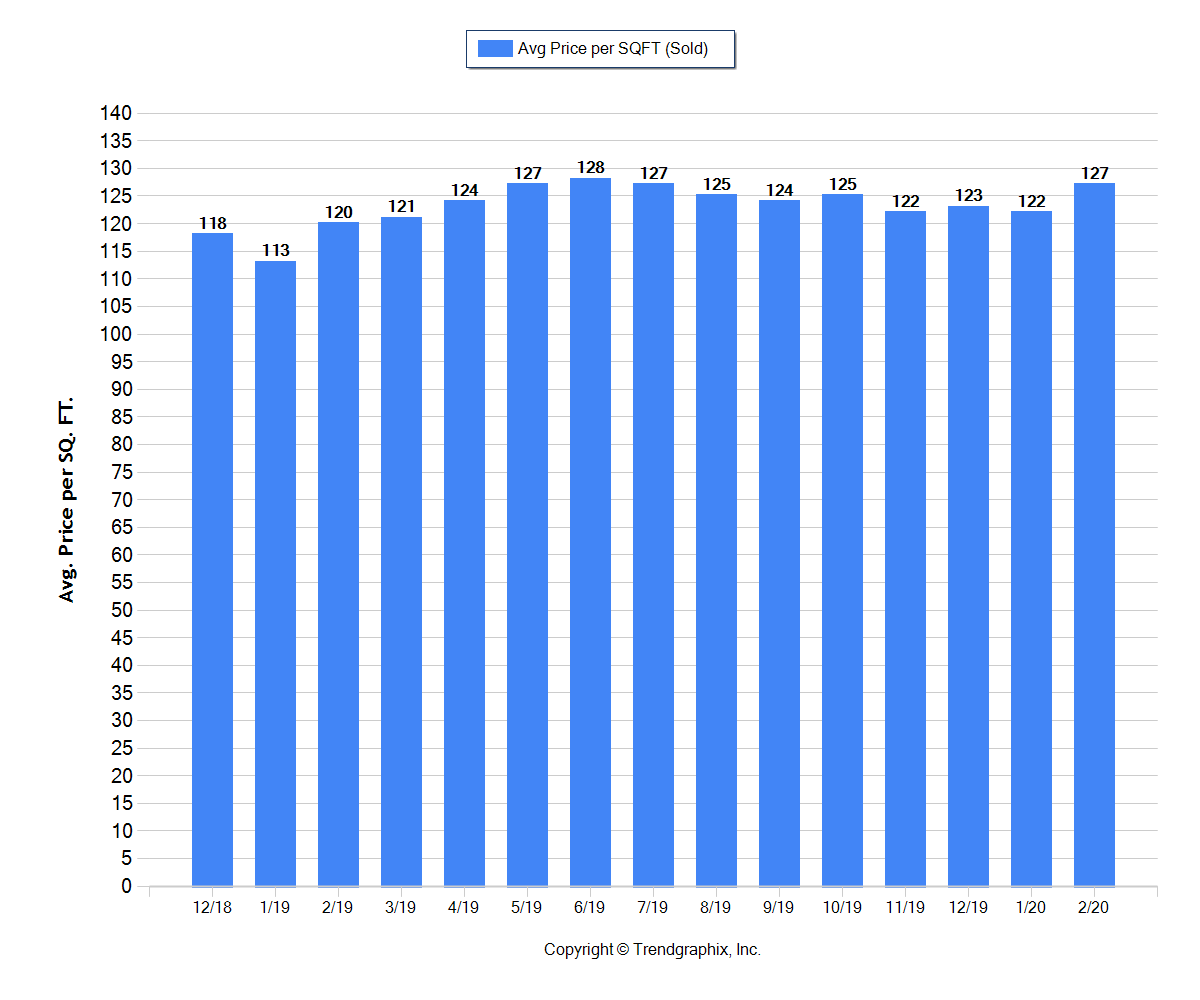
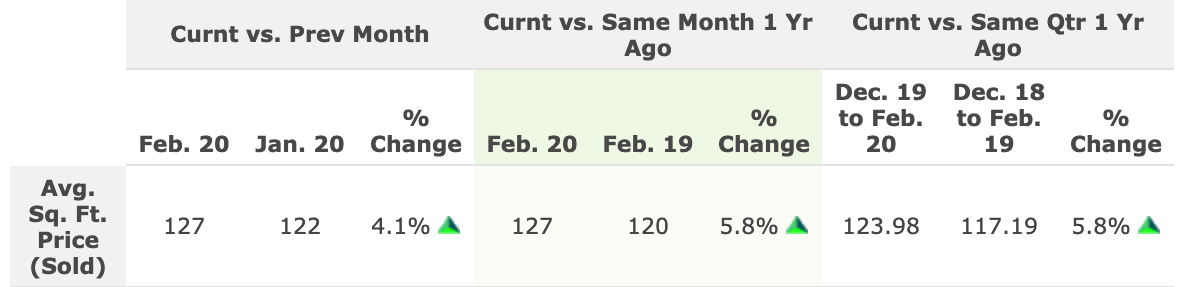
📐Central Ohio Average Price Per Square Foot
The Average Price per Square Foot on Sold homes trend is Appreciating.* In February 2020 the Average Price Per Square Foot was $127.
• Up 4.1% compared to January 2020
• Up 5.8% compared to February 2019
*Based on 6-month trend – Appreciating/Depreciating/Neutral
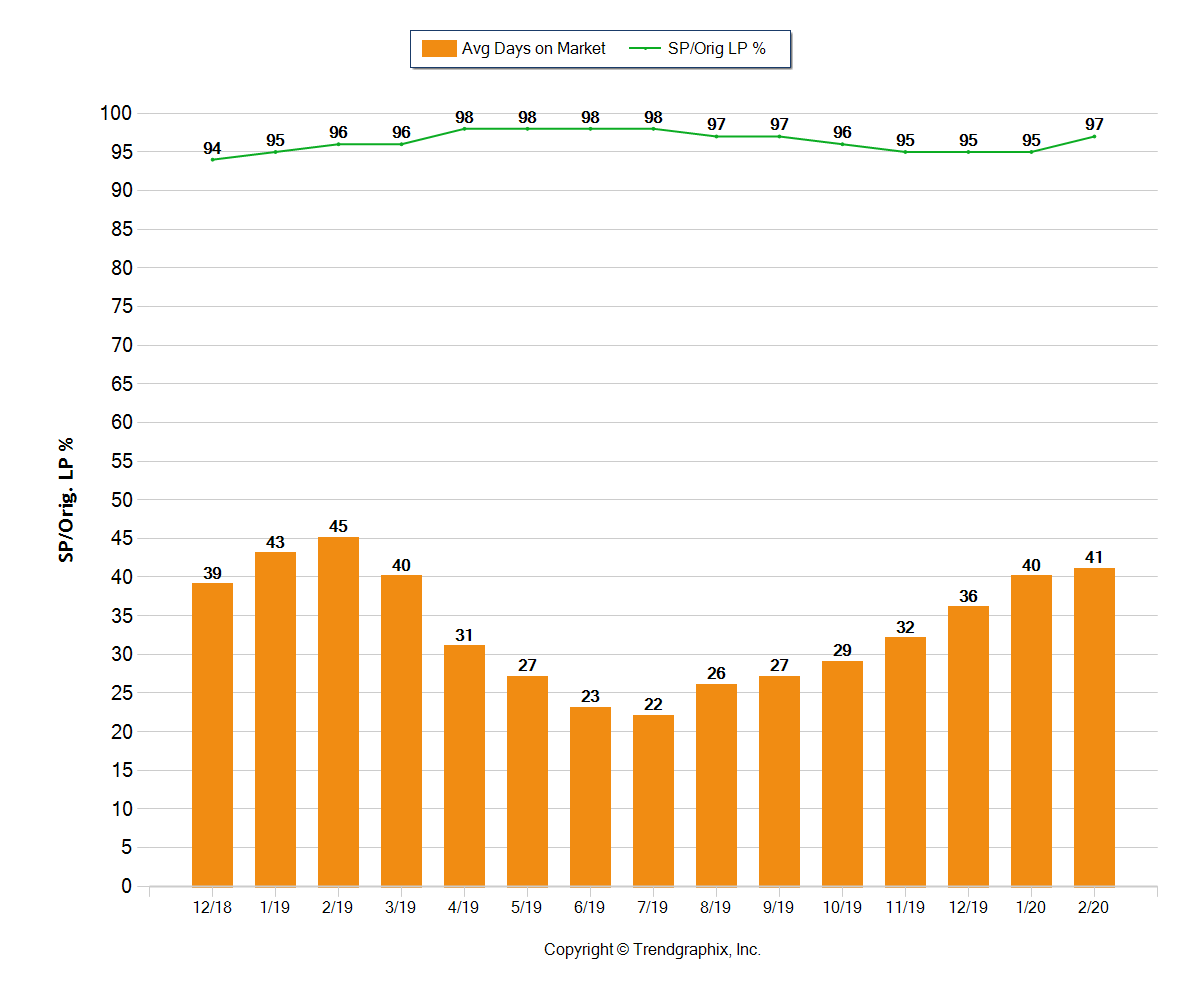
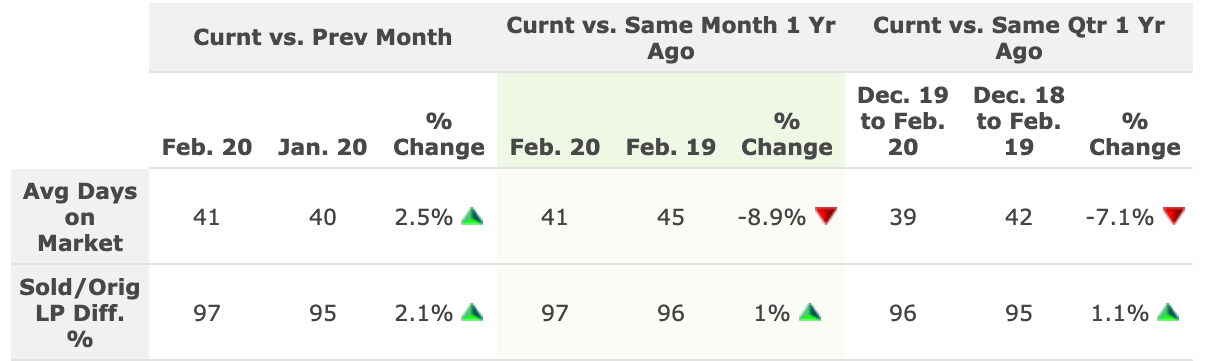
📉Central Ohio Days on Market
The average Days On Market trend in the Columbus area is Rising.*
The Average Days on Market in February 2020 was 41 days.
• Up 2.5% compared to January 2020
• Down 8.9% compared to February 2019
The Sold/Original List Price Ratio is Falling* at 97% for February 2020.
• Up 2.1% compared to January 2020
• Up 1% compared to February 2019
*Based on 6-month trend – Rising/Falling/Remains Steady
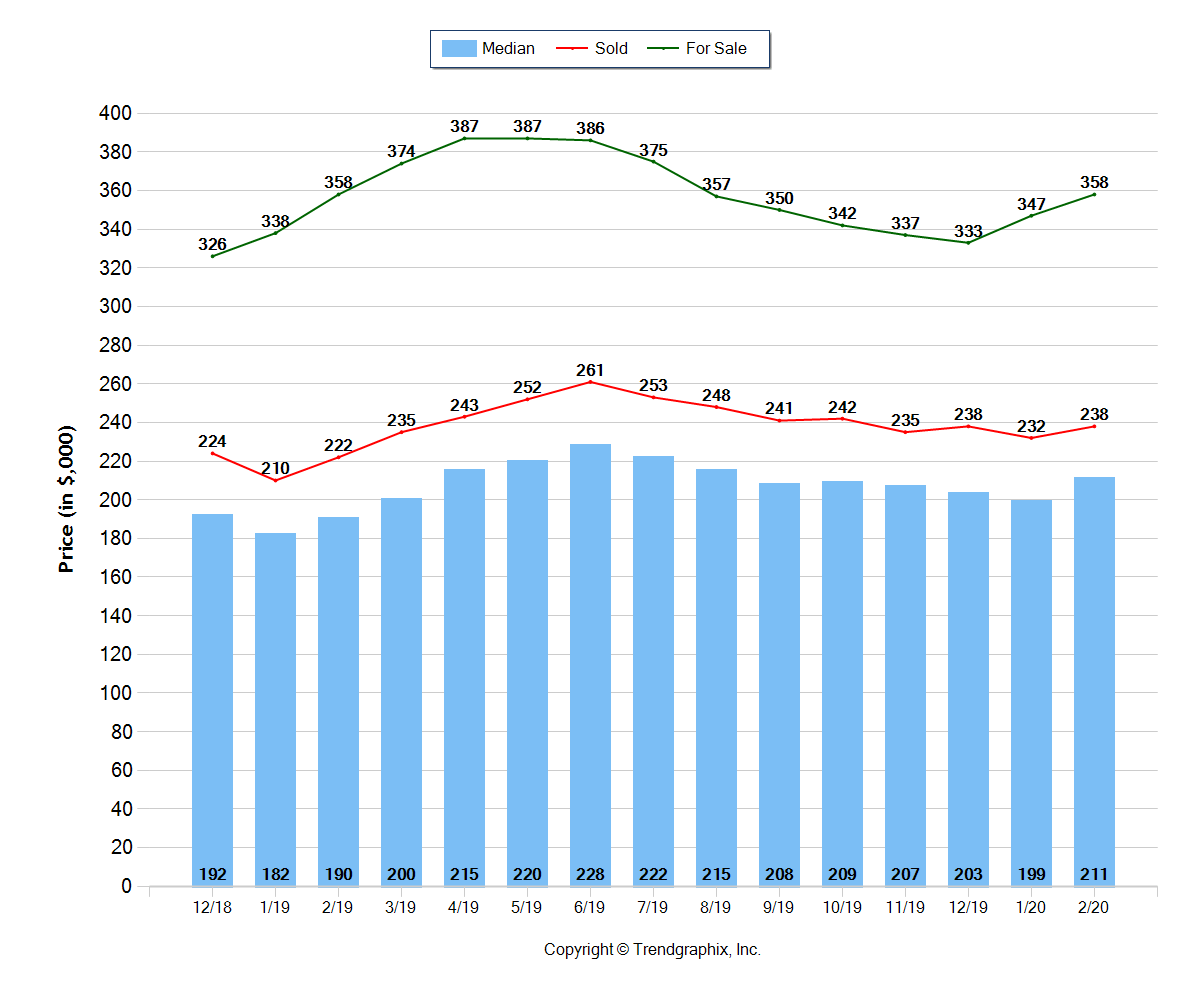
💲Central Ohio Housing Prices
The Median Sold Price trend is Depreciating* The Median Sold Price for February 2020 was $211k.
• Up 6% compared to January 2020
• Up 11.1% compared to February 2019
The Average For Sale Price trend is Appreciating.* The Average For Sale Price in February 2020 was $358k.
• Up 3.2% compared to January 2020
• 0% compared to February 2019
The Average Sold Price trend is Neutral.* The Average Sold Price in February 2020 was $238k.
• Up 2.6% compared to January 2020
• Up 10.2% compared to February 2019
*Based on 6-month trend – Appreciating/Depreciating/Neutral

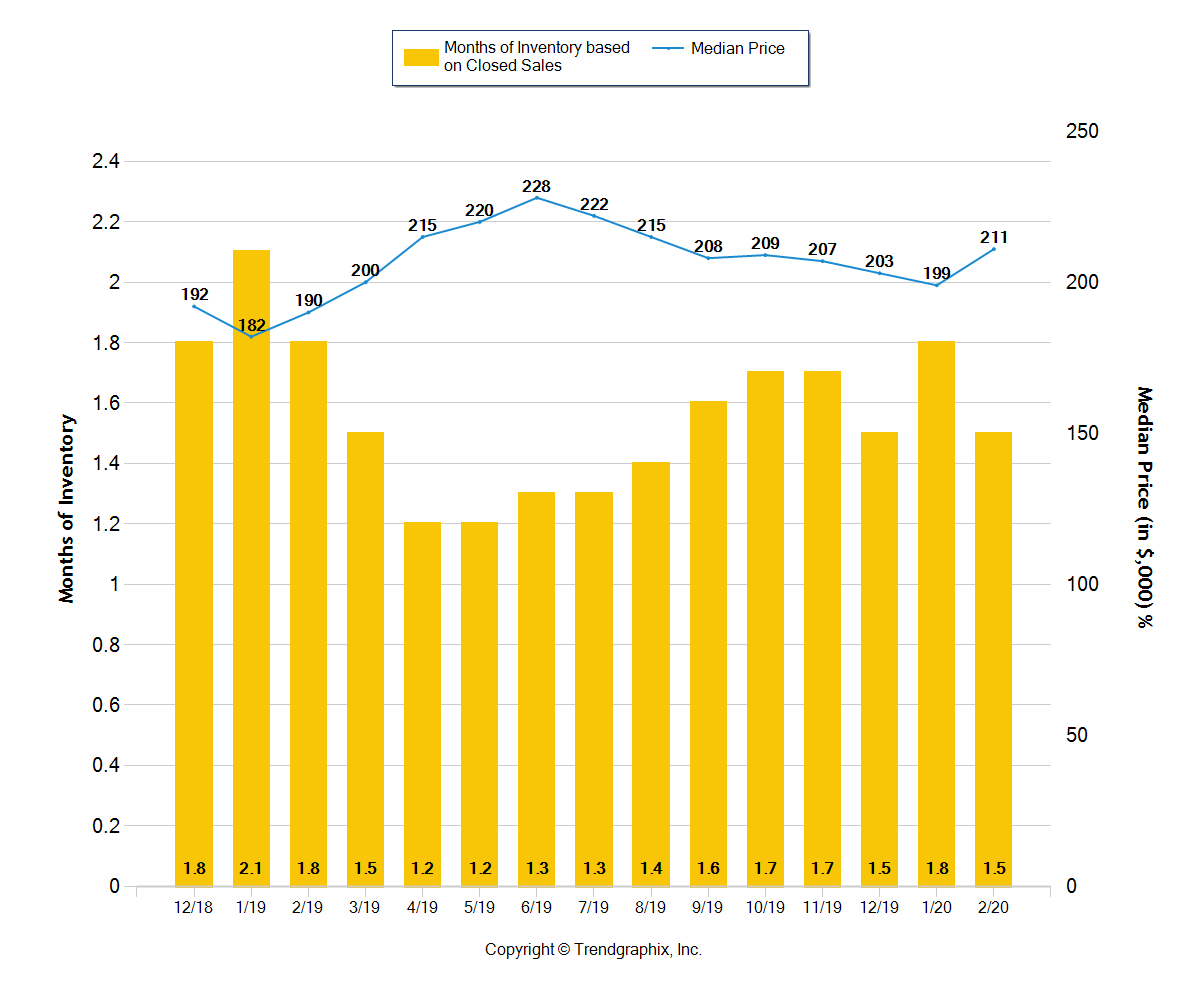
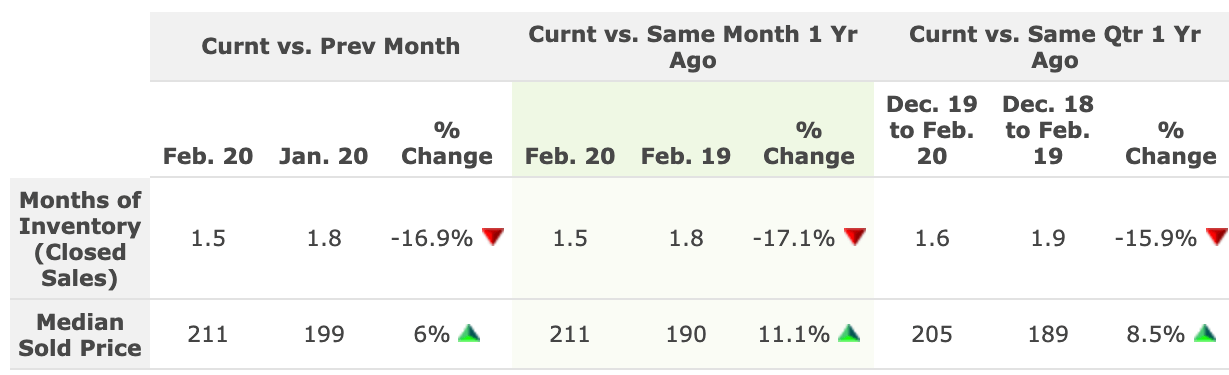
🏘️ Central Ohio Months Of Inventory
It’s still a Seller’s Market* in Columbus, Ohio!
The Months of Inventory based on Closed Sales in February 2020 was 1.5.
• Down 16.9% compared to January 2020
• Down 17.1% compared to February 2019
*Seller’s market: less than 3 months of inventory based on closed sales
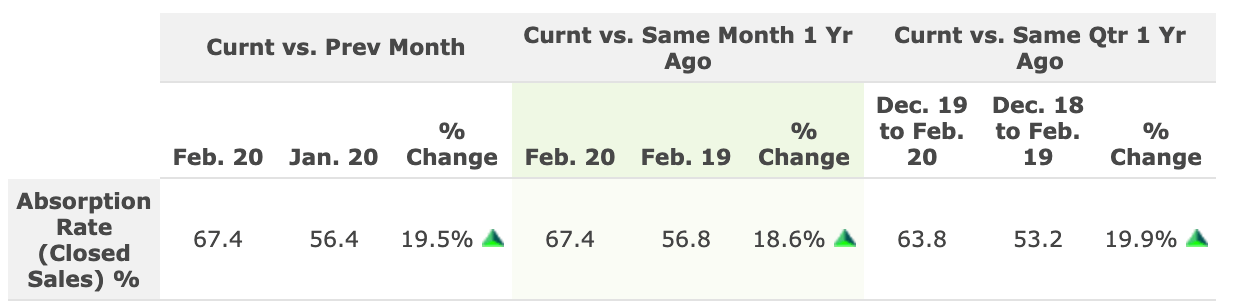
📈Central Ohio Absorption Rate
The Absorption Rate based on Closed Sales in February 2020 was 67.4.
• Up 19.5% compared to January 2020
• Up 18.6% compared to February 2019
*Seller’s market: 33.33% and above based on closed sales

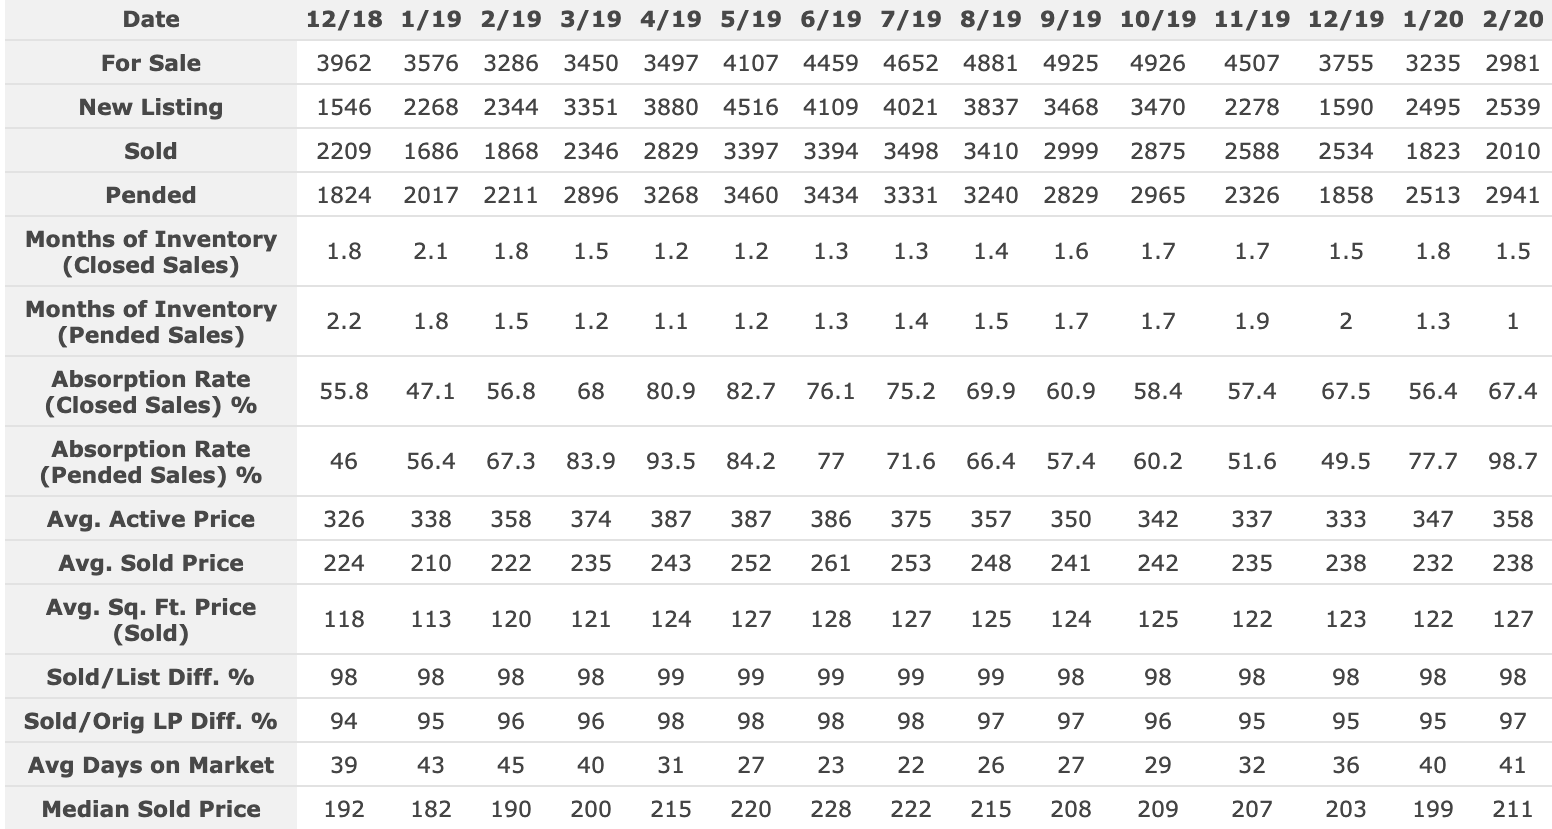
Central Ohio Housing Market Report At A Glance

Use this table to quickly see how the Columbus, Ohio area real estate market is doing.
Central Ohio Home Sellers
We’re still in a Seller’s Market in Central Ohio, and home values are in a long term uptrend.
If you are ready to sell your Columbus home soon, now is the time to start preparing, especially with decluttering and spring cleaning if you’re stuck at home. Get in touch with us about preparing your home for the market. An expert agent is the best person to help you decide which updates to consider and how much to spend. You want your home to be move-in ready for buyers, but you don’t want to go overboard with updates and improvements that eat into your profits. Deep cleaning ALWAYS helps a home sell.
Buyer demand may be delayed in the short term. But, once we get past this healthcare crisis (and we will), buyers will be back out buying homes. Whatever the market conditions are when you list your home, it’s very important that you do not overprice it.
Questions about the home selling process? Check out our Seller FAQ section.
Please Note: Market conditions vary between neighborhoods and price points. Call or text Columbus Realtor Rita Boswell at 614-830-9767 to learn more about market conditions in your specific community.
Get Your Home’s Value InstantlyColumbus OH Home Buyers
Interest rates are likely going lower, and home values are predicted to continue to rise in Columbus. Builders are way behind, so housing demand due to low supply isn’t going away anytime soon. It’s understandable if you do not want to see homes in the near term, but once we get past this, it could be an ideal time to buy a home. Start your home search anytime on our website.
Browse Price Reduced Homes In Central OhioBecause we’re still in an overall seller’s market, pre-approval is key. Preparation will help you win your dream home, even if you find yourself in a bidding war. Connect with a mortgage professional to get started.
Use a Top Home Buying Agent to help you find homes that fit your needs and budget. Be ready to make a competitive offer when you find the right home.
Browse Today’s Newest ListingsAbout Central Ohio Real Estate Market Reports
“At the Rita Boswell Group, our goal is to provide home buyers and sellers with the most recent, in-depth market information possible.
Our report is based on data supplied by the Columbus Board of Realtors or its MLS. Information is deemed reliable but not guaranteed. Specific data points provided above may be adjusted, which will be reflected in future reports.
Our Central Ohio real estate market reports cover the counties of Franklin, Delaware, Fairfield, Licking, Madison, Pickaway, and Union. For market information on a specific community, contact Realtor Rita Boswell at 614-830-9767.”