June numbers show that the market remained as hot as the temperatures!
July usually sees a small, temporary market slow down as many people go on their summer vacations this month, so expect that to be reflected in next month’s report.
Read More to see how the Central Ohio real estate market did in June and to view trends.
- 🏘️ Central Ohio Homes For Sale, Listed, Sold, & Pending
- 📐Central Ohio Average Price Per Square Foot
- 📉Central Ohio Days on Market
- 💲Central Ohio Housing Prices
- 🏘️ Central Ohio Months Of Inventory
- 📈Central Ohio Absorption Rate
- Central Ohio Real Estate Market Report At A Glance
- Central Ohio Home Sellers
- Columbus OH Home Buyers
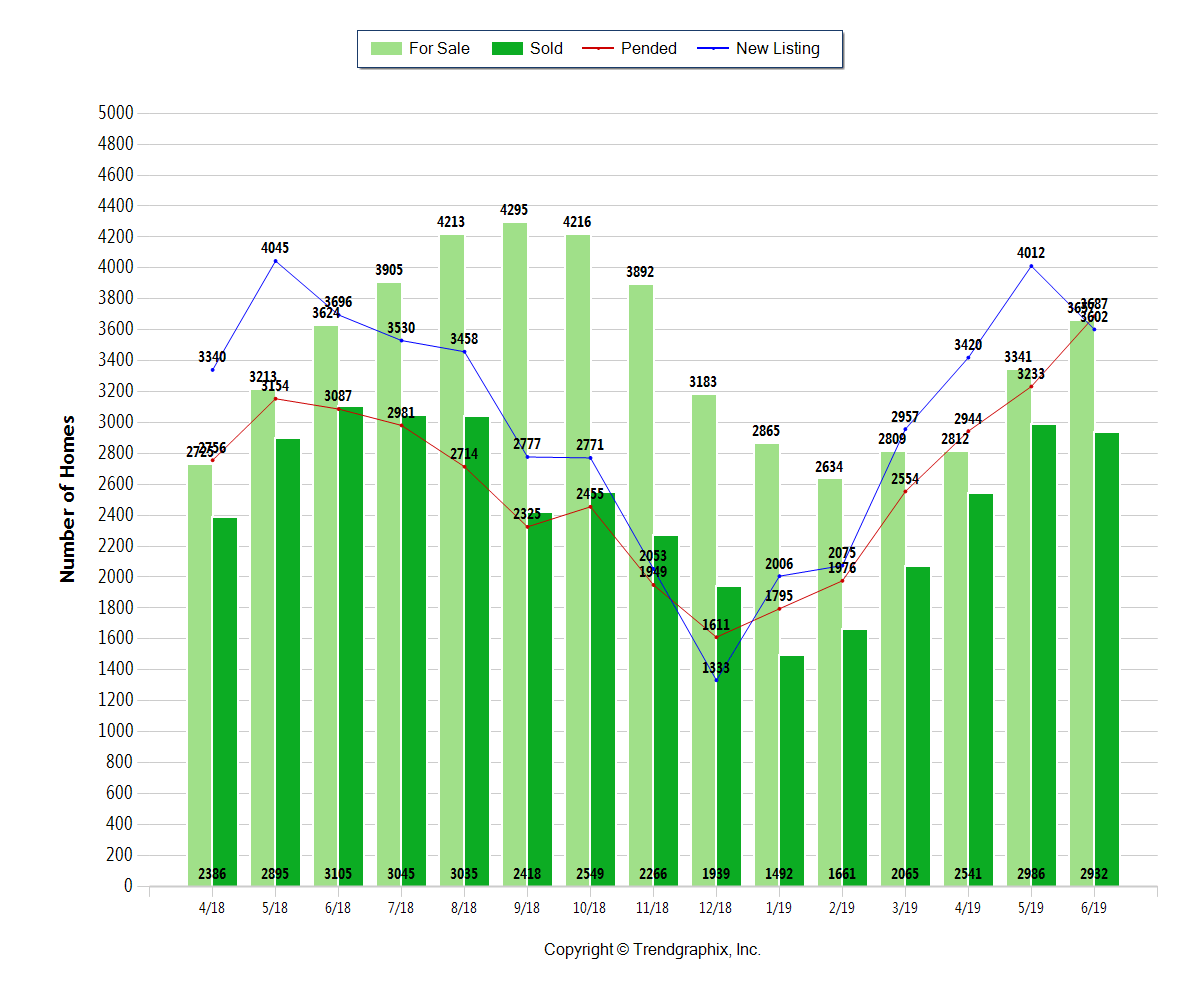
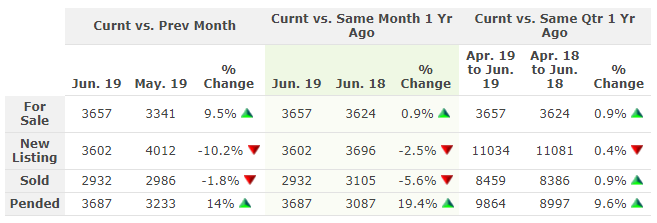
🏘️ Central Ohio Homes For Sale, Listed, Sold, & Pending
The number of Homes For Sale in June 2019 was 3657 units.
•  Up 9.5% compared to May 2019
• Up 0.9% compared to June 2018
The number of Homes Listed in June 2019 was 3602 units.
•  Down 10.2% compared to May 2019
• Down 2.5% compared to June 2018
The number of Homes Closed in June 2019 was 2932 units.
• Down 1.8% compared to May 2019
• Down 5.6% compared to June 2018
The number of Homes Placed Under Contract in June 2019 was 3687 units.
• Up 14% compared to May 2019
• Up 19.4% compared to June 2018
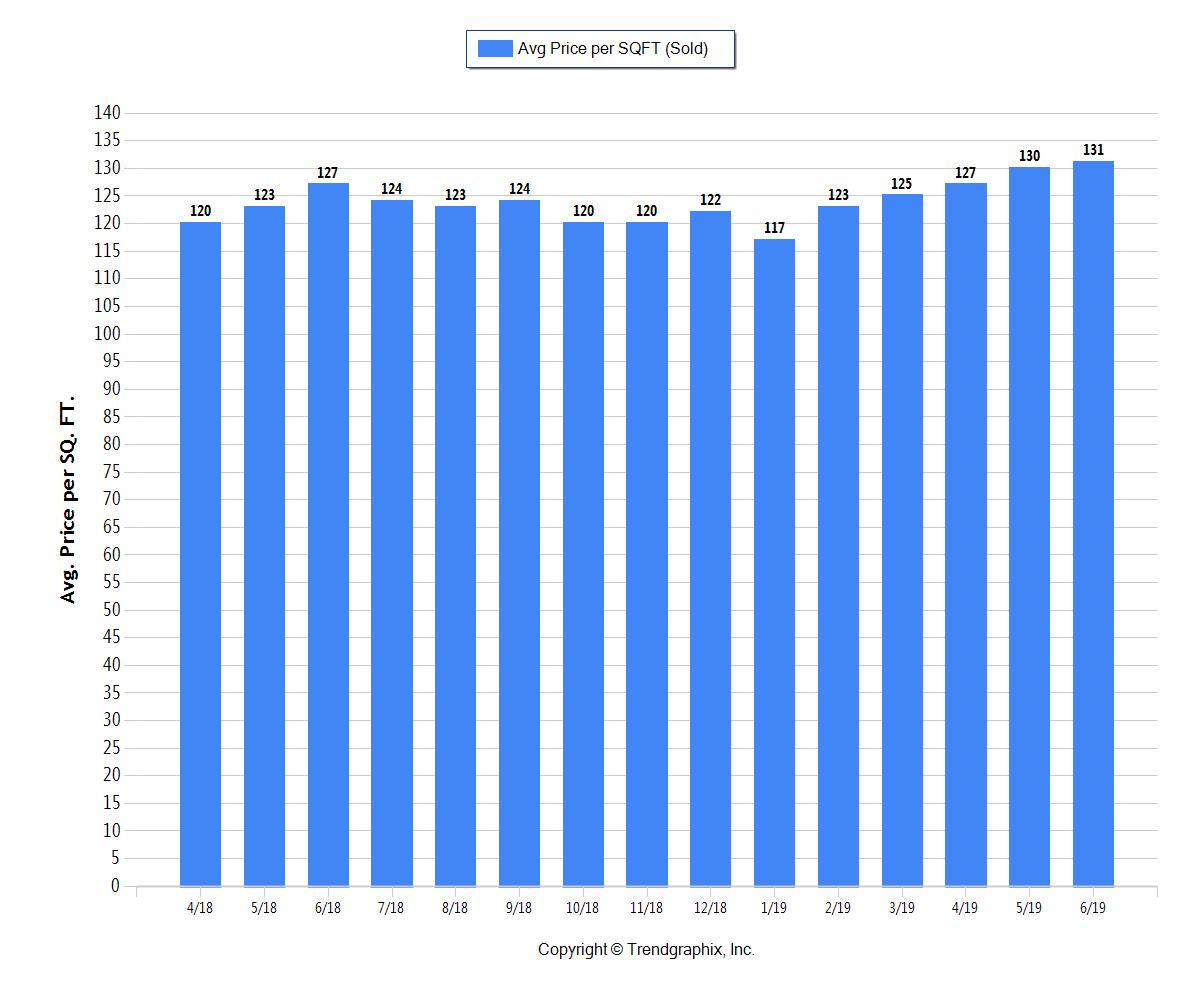
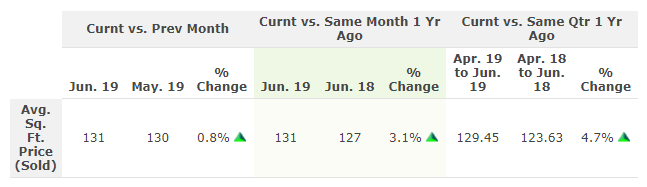
📐Central Ohio Average Price Per Square Foot
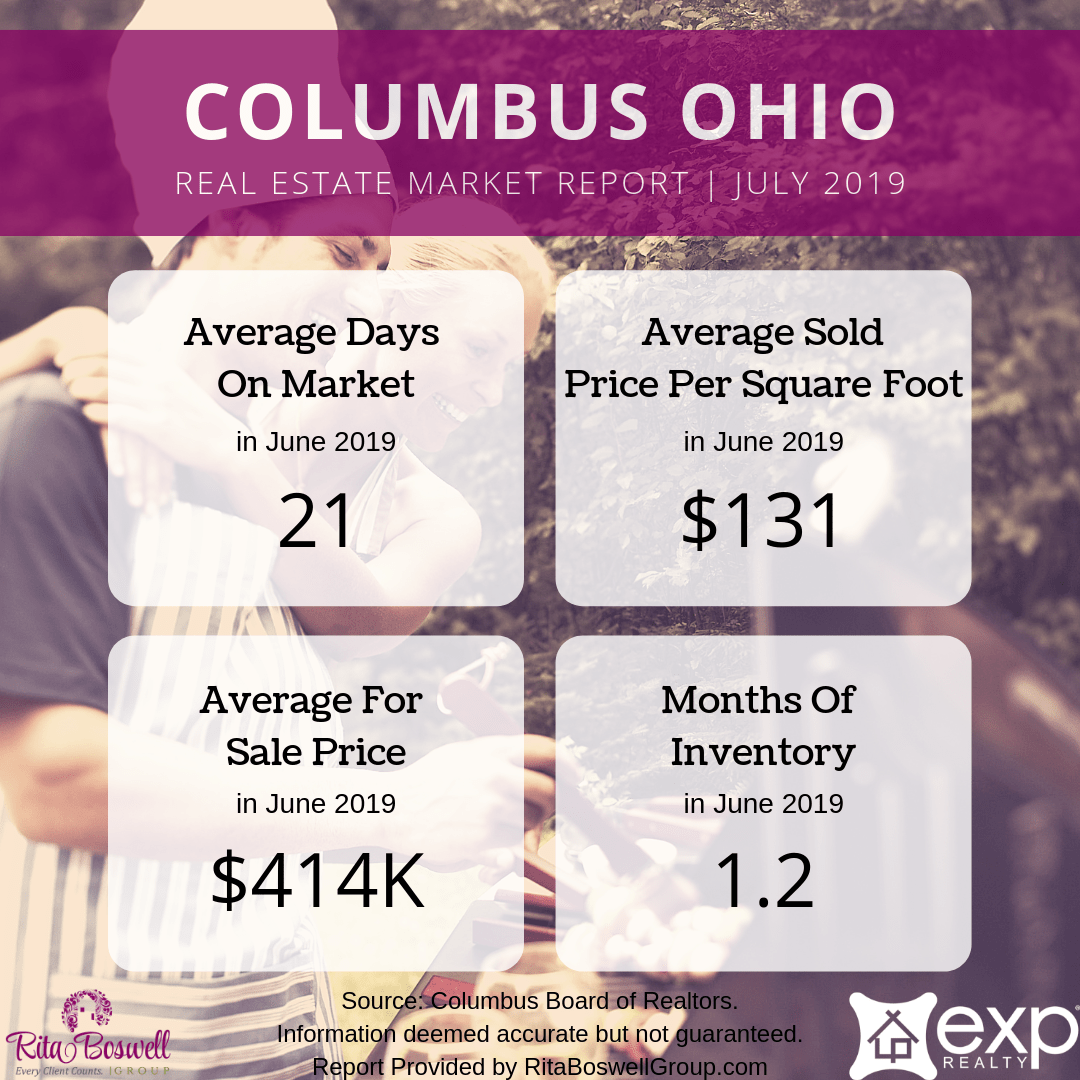
The Average Price per Square Foot on Sold homes trend is again Appreciating.* In June 2019 the Average Price Per Square Foot was $131.
• Up 0.8% compared to May 2019
• Up 3.1% compared to June 2018
*Based on 6 month trend – Appreciating/Depreciating/Neutral
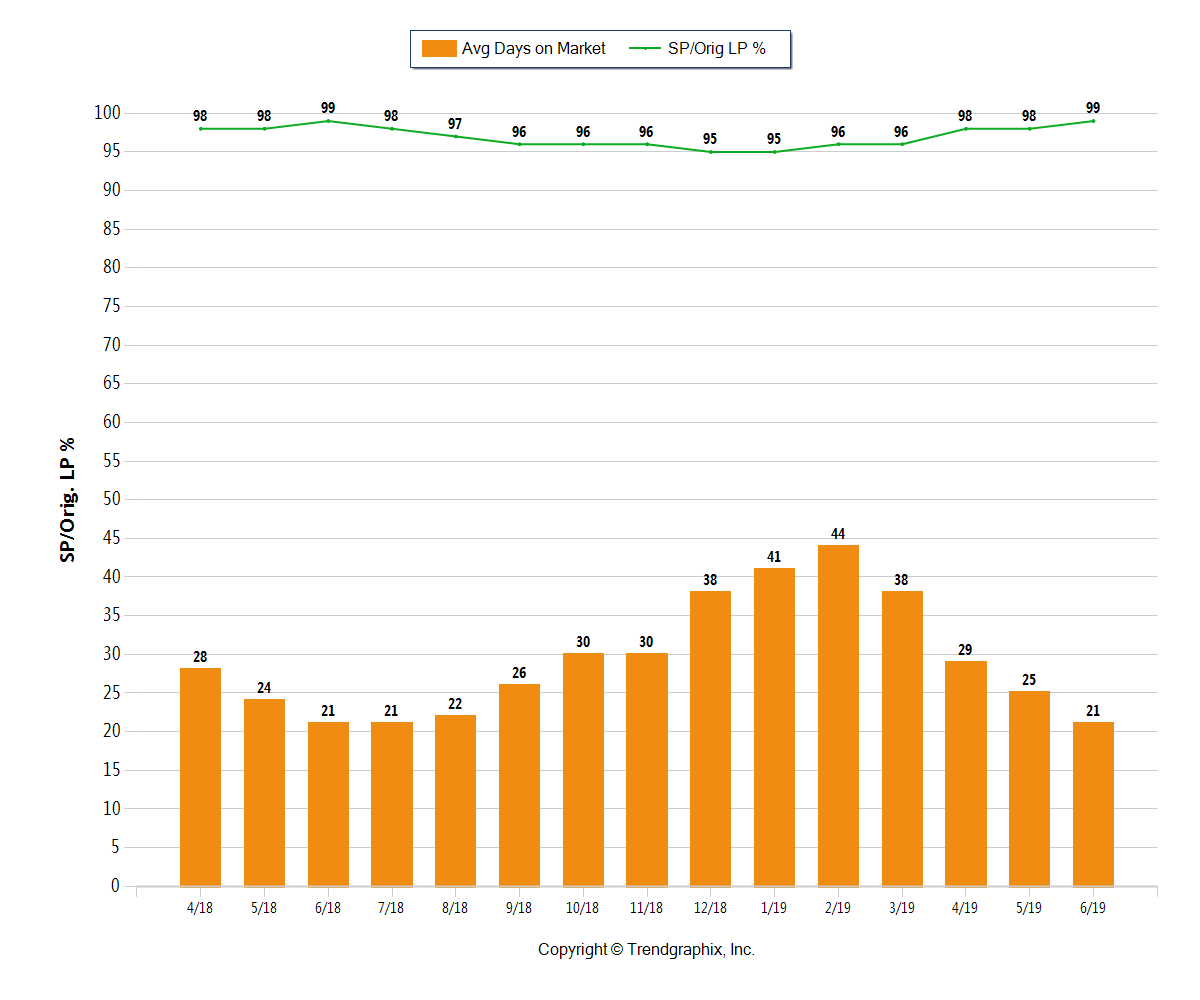
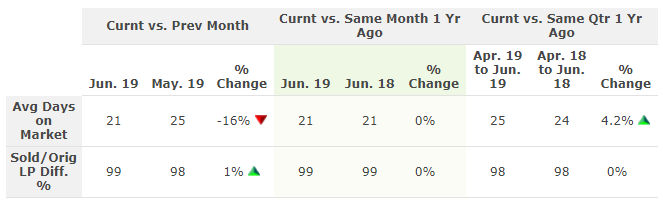
📉Central Ohio Days on Market
The average Days On Market trend in the Columbus area is Falling.*
The Average Days on Market in June 2019 was 21 days.
• Down 16% compared to May 2019
• Up 3.1% compared to June 2018
The Sold/Original List Price Ratio is Rising* at 99% for June 2019.
• Up 1% compared to May 2019
• 0% compared to June 2018
*Based on 6 month trend – Rising/Falling/Remains Steady
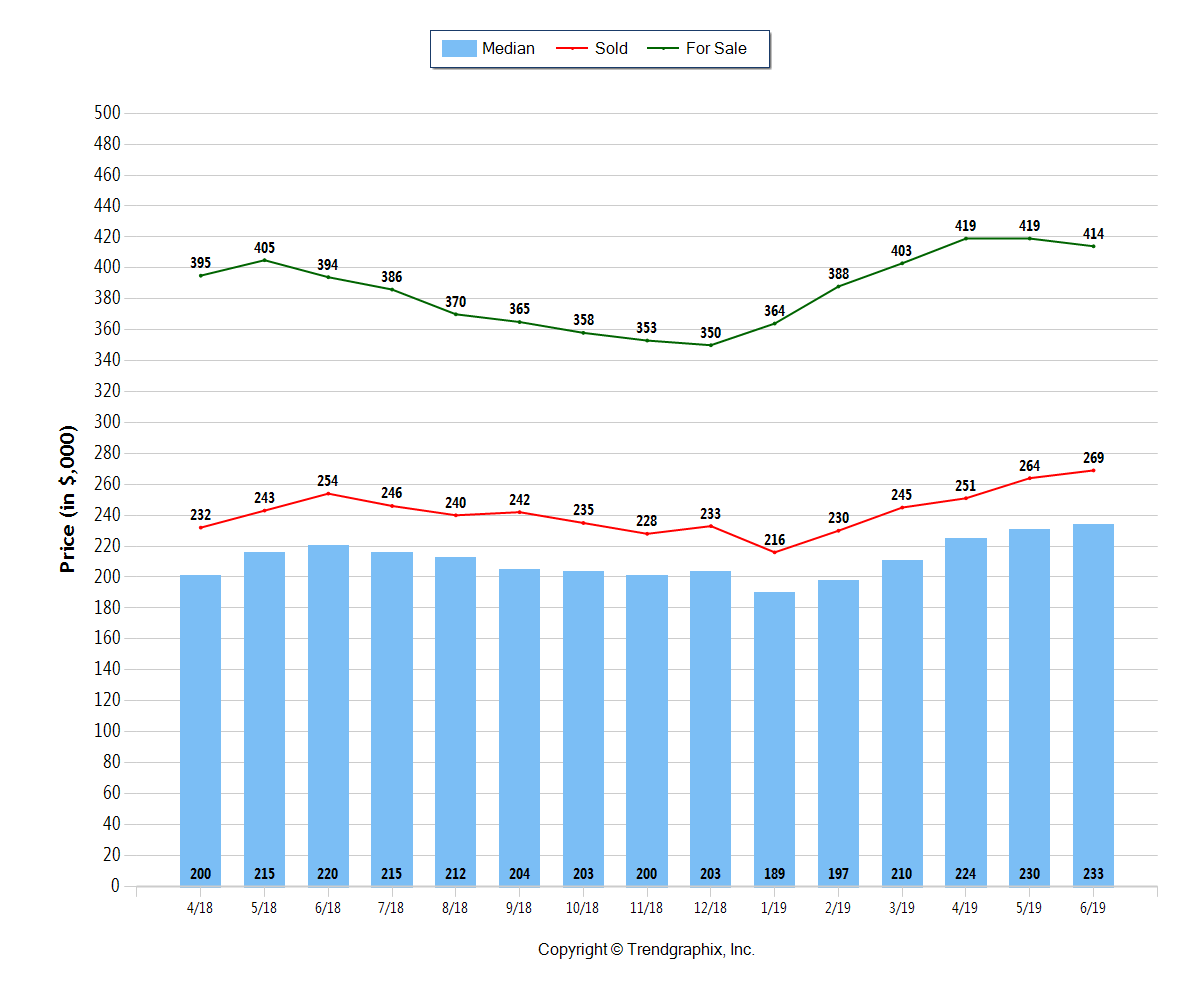
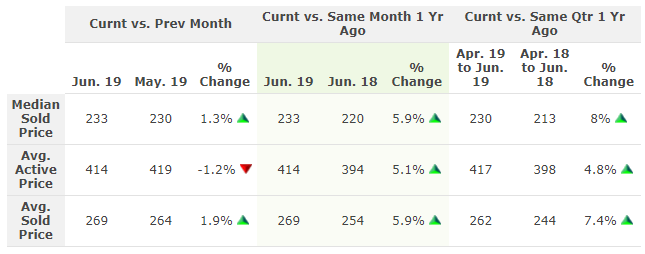
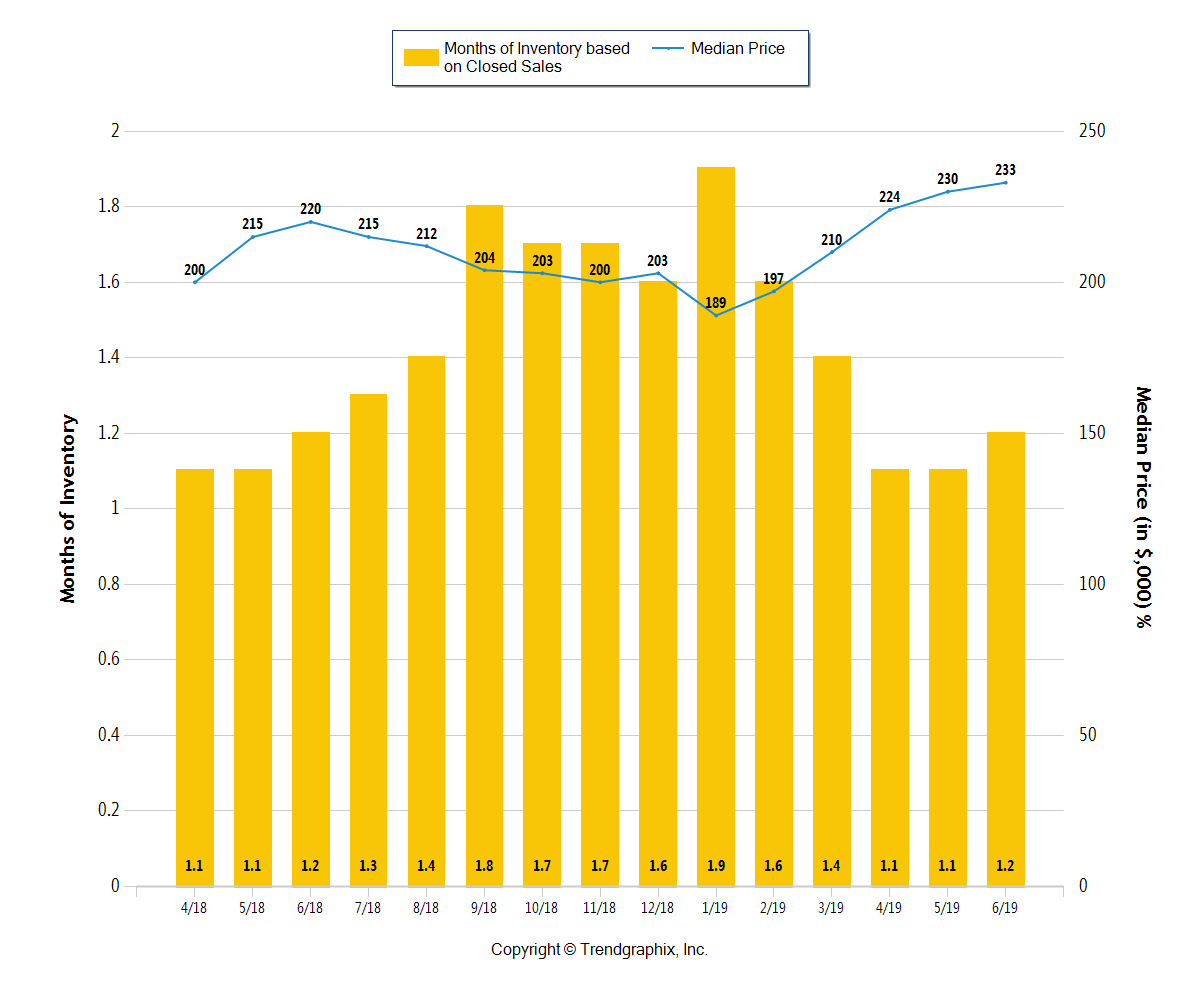
💲Central Ohio Housing Prices
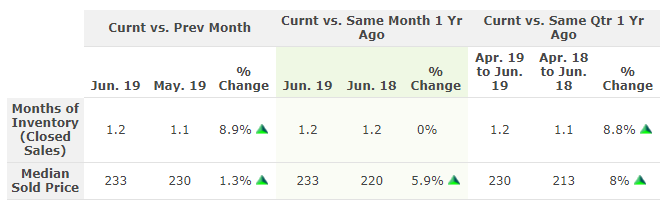
The Median Sold Price trend is Appreciating* The Median Sold Price for June 2019 was $233k.
• Up 1.3% compared to May 2019
• Up 5.9% compared to June 2018
The Average For Sale Price trend is Neutral.* The Average For Sale Price in June 2019 was $414k.
• Down 1.2% compared to May 2019
• Up 5.1% compared to June 2018
The Average Sold Price trend is Appreciating.* The Average Sold Price in June 2019 was $269k.
• Up 1.9% compared to May 2019
• Up 5.9% compared to June 2018
*Based on 6 month trend – Appreciating/Depreciating/Neutral
🏘️ Central Ohio Months Of Inventory
It’s still a Seller’s Market* in Columbus, Ohio!
The Months of Inventory based on Closed Sales in June 2019 was 1.2.
• Up 8.9% compared to May 2019
• 0% compared to June 2018
*Seller’s market: less than 3 months of inventory based on closed sales
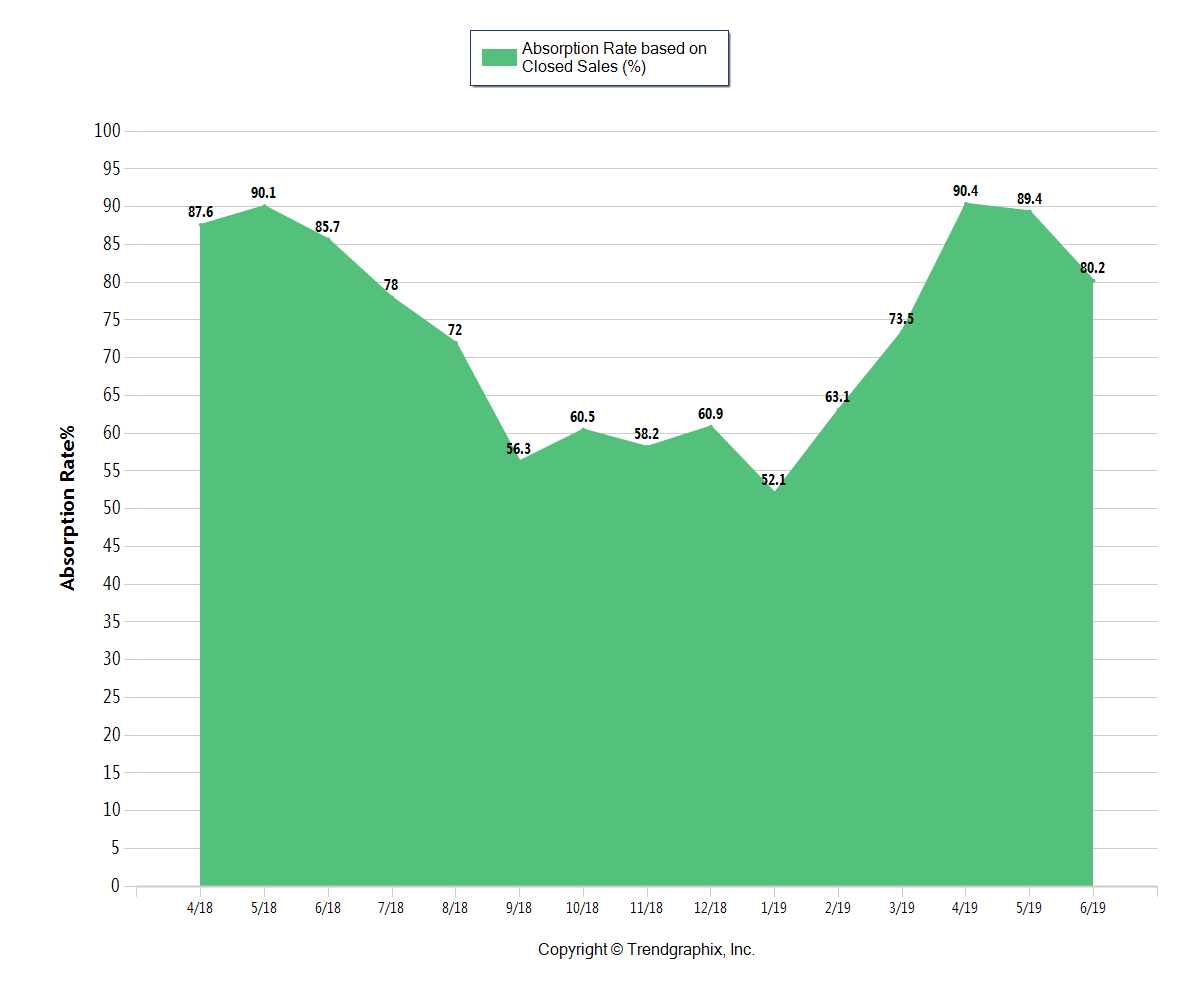
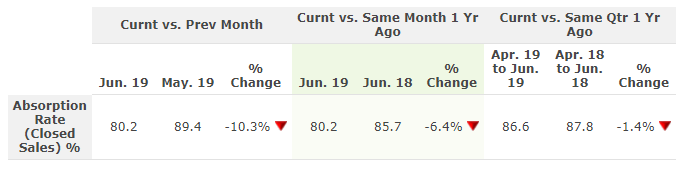
📈Central Ohio Absorption Rate
The Absorption Rate based on Closed Sales in June 2019 was 80.2.
• Down 10.3% compared to May 2019
• Down 6.4% compared to June 2018
*Seller’s market: 33.33% and above based on closed sales
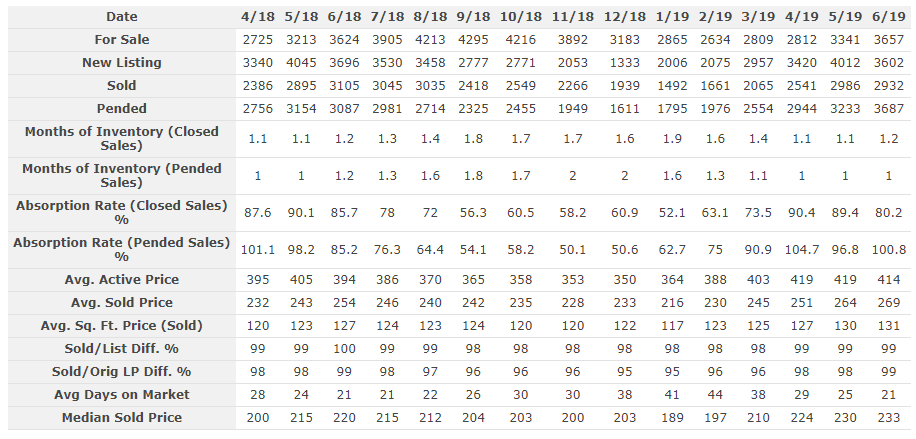
Central Ohio Real Estate Market Report At A Glance
Use this table to quickly see how the Columbus, Ohio area real estate market is doing.
Central Ohio Home Sellers
Planning to sell your home soon? Sellers Markets don’t last forever. Right now is a great time to get your home ready to sell, if you haven’t yet. If you get it listed by August, it could be sold by September (provided that it’s priced correctly, of course).
In the fall and winter, home prices tend to shift down with the slower season.
If you want to list and sell your home, talk with a top Columbus real estate agent.
Market conditions vary even by neighborhood. Call or text Columbus Realtor Rita Boswell at 614-830-9767 to learn more about market conditions in your specific community.
Get Your Home’s Value InstantlyColumbus OH Home Buyers
Mortgage rates are still low, and home are values in Central Ohio are predicted to continue rising, so it’s a great time to buy a home. Combine those factors with the coming fall/winter slowdown, and it may just be the perfect time to start your home search.
It’s still a seller’s market though, so be prepared. If you’re serious about buying a home in the near future, be ready before finding the perfect home. Fix any issues with your credit. Then, talk with a mortgage professional to get pre-approved.
Work with a Top Home Buying Agent to help you find homes that fit your needs and budget. Be ready to make a realistic, competitive offer when you find a home you like.
Browse Today’s Newest ListingsAbout Central Ohio Real Estate Market Reports
“At the Rita Boswell Group, our goal is to provide home buyers and sellers with the most recent, in-depth market information possible.
Our report is based on data supplied by the Columbus Board of Realtors or its MLS. Information is deemed reliable but not guaranteed. Specific data points provided above may be adjusted, which will be reflected in future reports.
Our Central Ohio real estate market reports cover the counties of Franklin, Delaware, Fairfield, Licking, Madison, Pickaway, and Union. For market information on a specific community, contact Realtor Rita Boswell at 614-830-9767.”