July numbers are in! We normally see a small slow down in July as many people go on vacation. The real estate market in Columbus usually picks back up by September before slowing again for the fall and winter.
As expected, home prices did fall slightly in July. However, days on market also fell.
New listings fell and the number of homes that went under contract moved up, showing that inventory will continue to be low.
Keep reading for the full report and to view trends.
- 🏘️ Central Ohio Homes For Sale, Listed, Sold, & Pending
- 📐Central Ohio Average Price Per Square Foot
- 📉Central Ohio Days on Market
- 💲Central Ohio Housing Prices
- 🏘️ Central Ohio Months Of Inventory
- 📈Central Ohio Absorption Rate
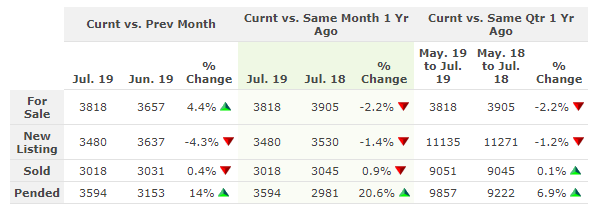
- Central Ohio Housing Market Report At A Glance
- Central Ohio Home Sellers
- Columbus OH Home Buyers
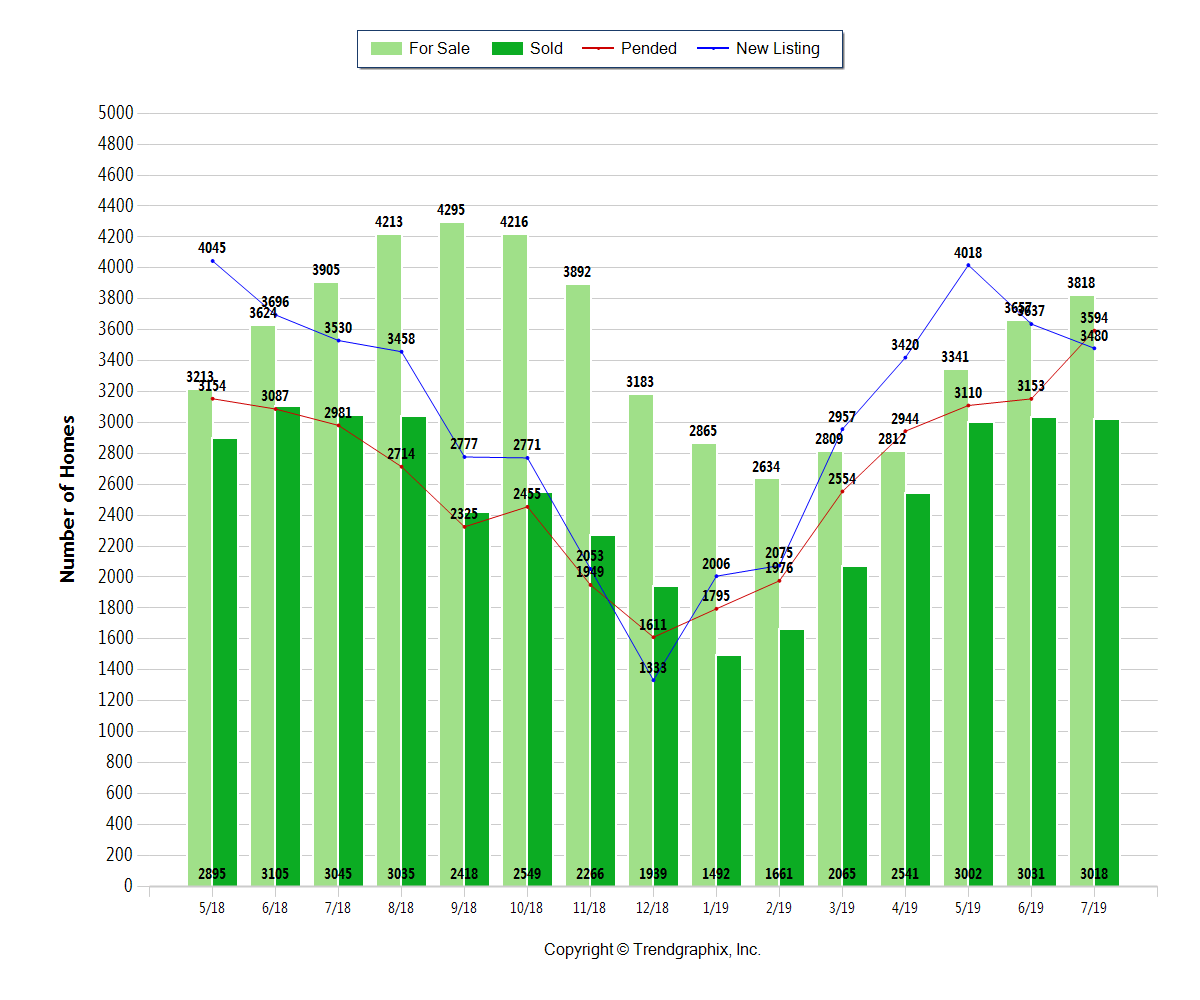
🏘️ Central Ohio Homes For Sale, Listed, Sold, & Pending
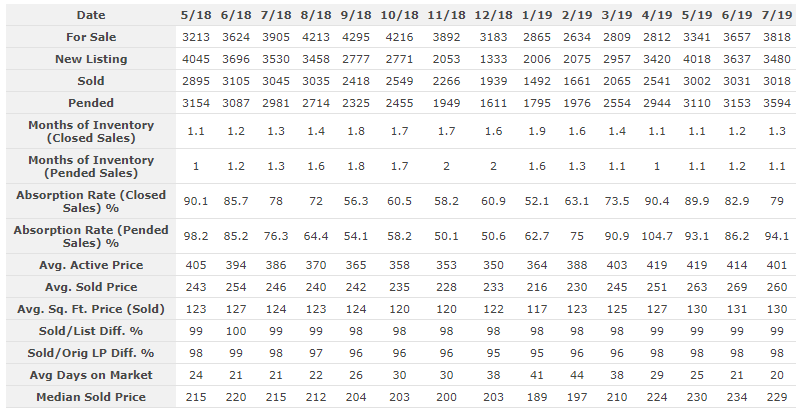
The number of Homes For Sale in July 2019 was 3818 units.
•  Up 4.4% compared to June 2019
•  Down 2.2% compared to July 2018
The number of Homes Listed in July 2019 was 3480 units.
• Down 4.3% compared to June 2019
• Down 1.4% compared to July 2018
The number of Homes Closed in July 2019 was 3018 units.
• Down 0.4% compared to June 2019
• Down 0.9% compared to June 2018
The number of Homes Placed Under Contract in July 2019 was 3594 units.
• Up 14% compared to June 2019
• Up 20.6% compared to July 2018
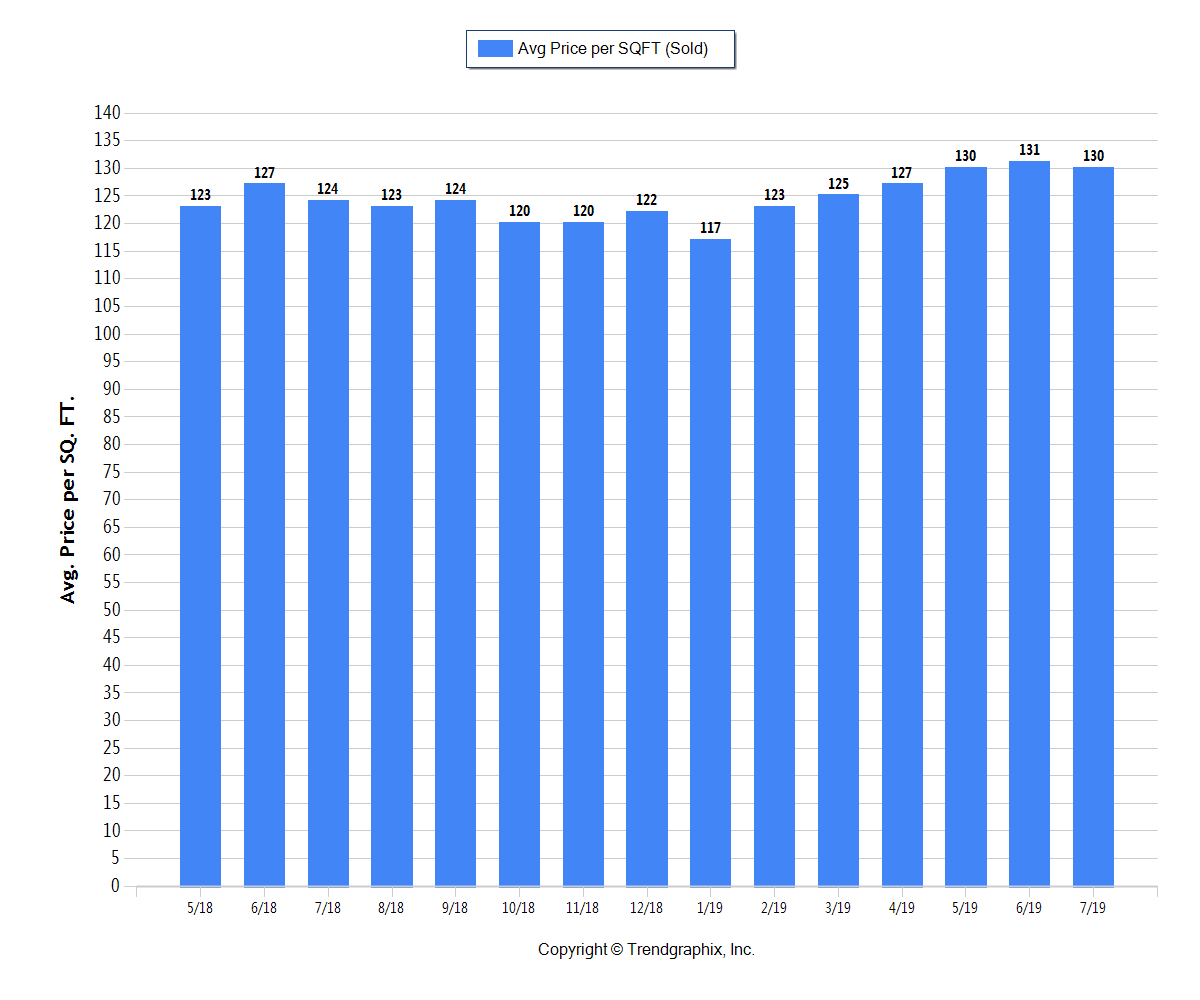
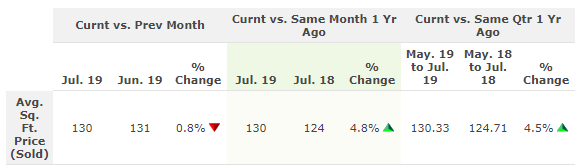
📐Central Ohio Average Price Per Square Foot
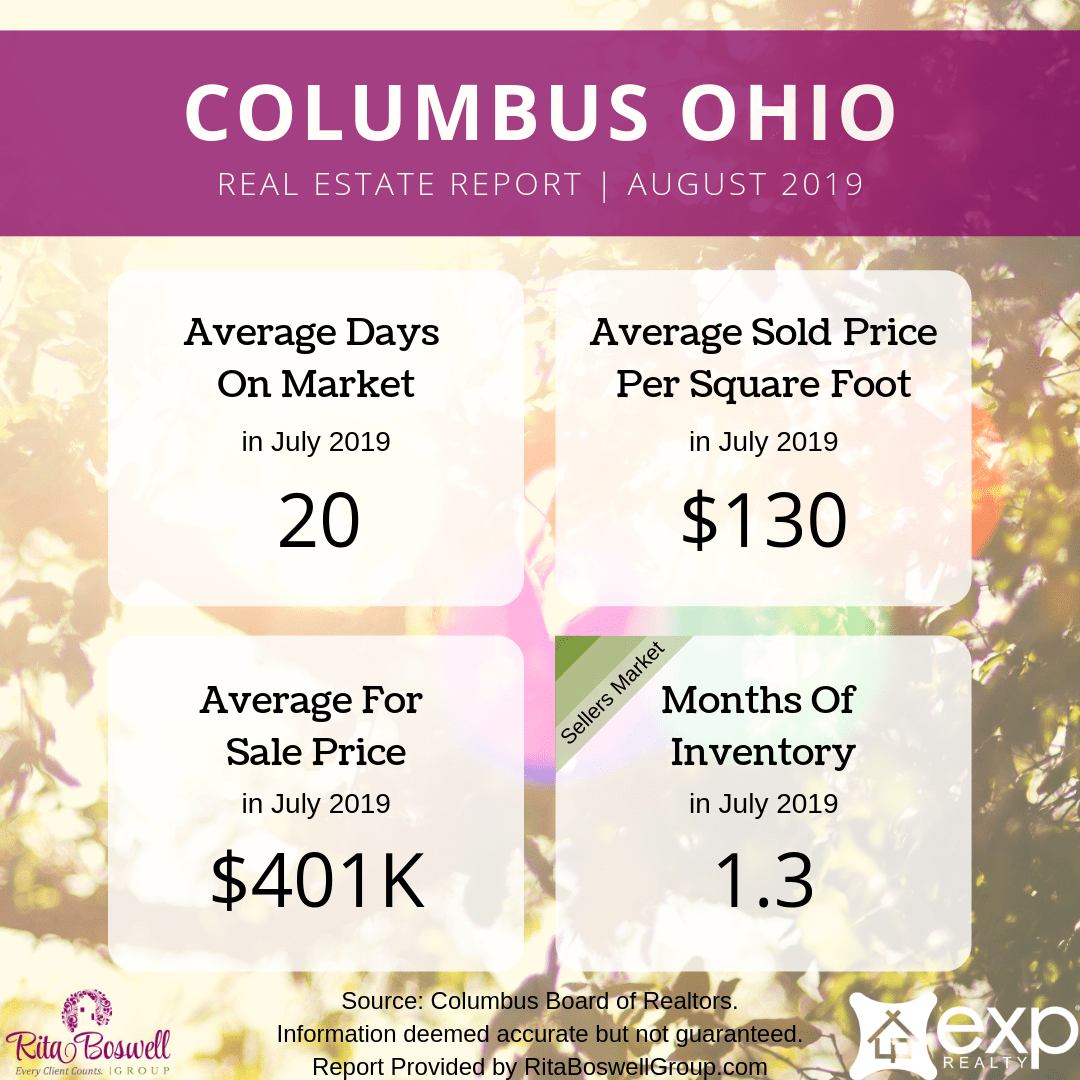
The Average Price per Square Foot on Sold homes trend is Neutral.* In July 2019 the Average Price Per Square Foot was $130.
• Down 0.8% compared to June 2019
• Up 4.8% compared to July 2018
*Based on 6 month trend – Appreciating/Depreciating/Neutral
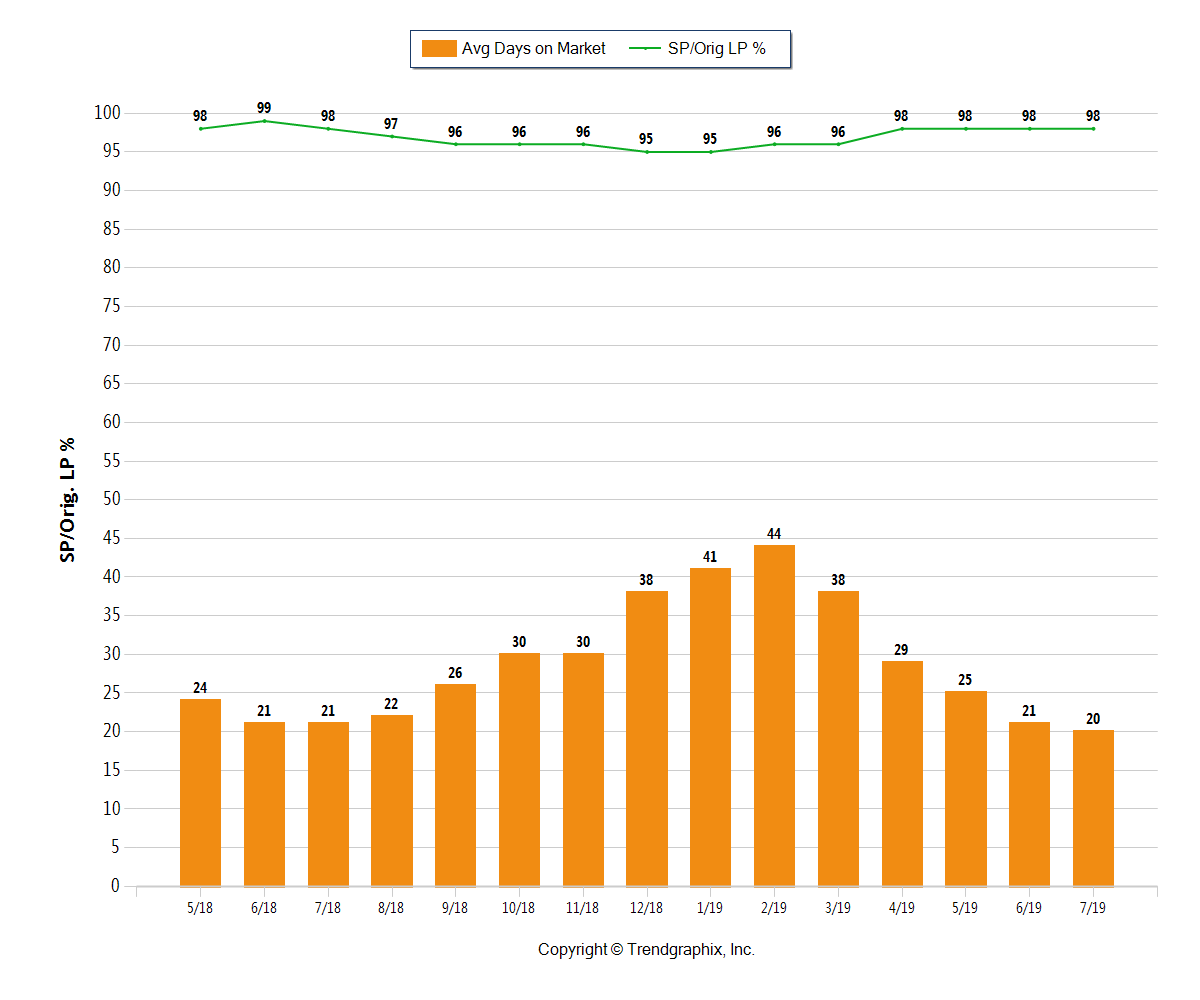
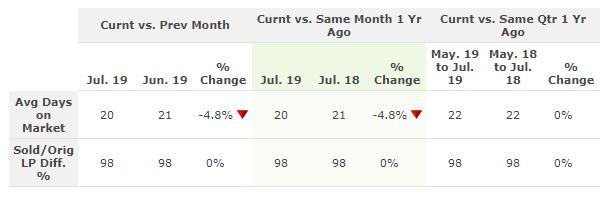
📉Central Ohio Days on Market
The average Days On Market trend in the Columbus area is Falling.*
The Average Days on Market in July 2019 was 20 days.
• Down 4.8% compared to June 2019
• Down 4.8% compared to July 2018
The Sold/Original List Price Ratio is Rising* at 99% for July 2019.
• 0% compared to June 2019
• 0% compared to July 2018
*Based on 6 month trend – Rising/Falling/Remains Steady
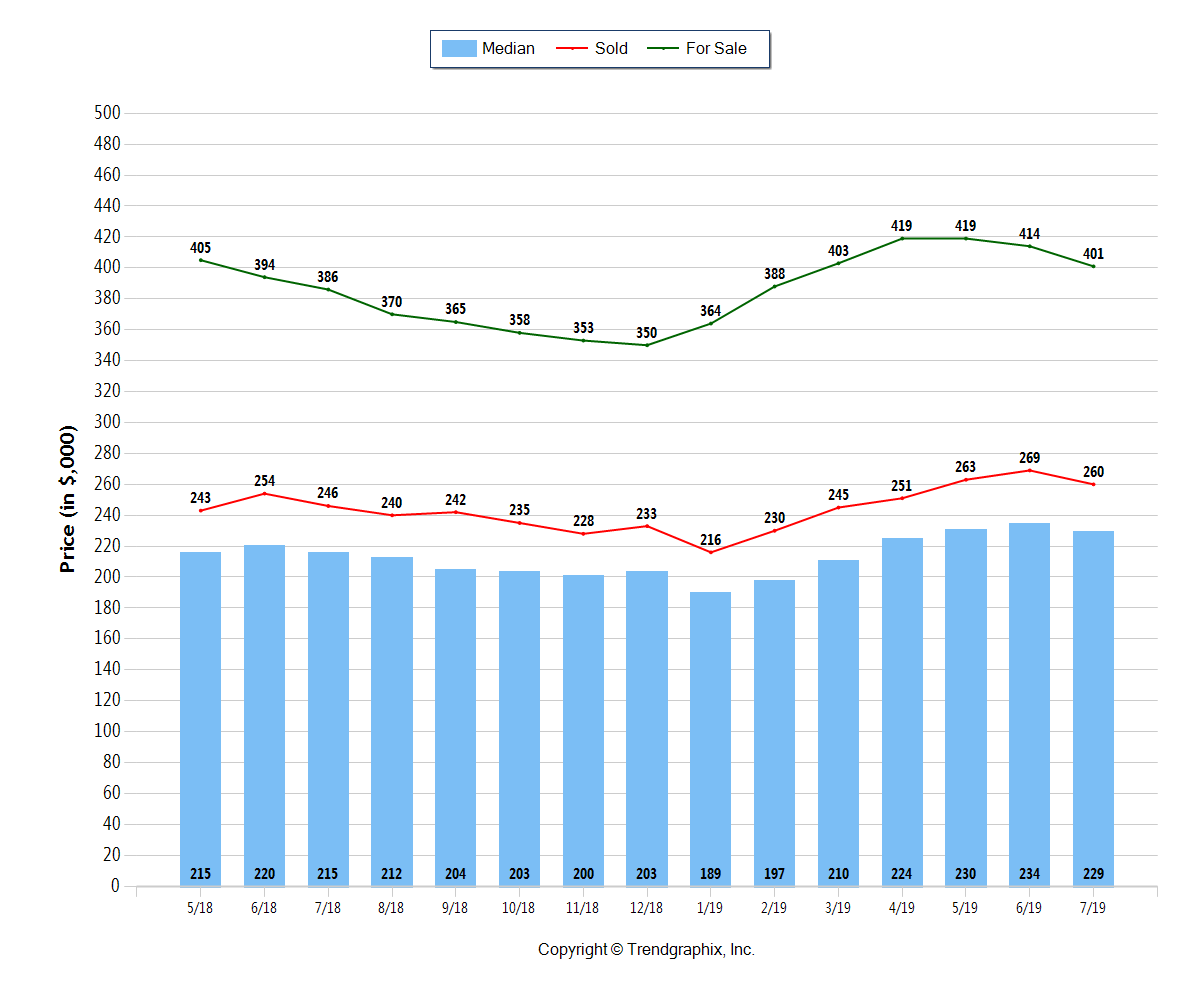
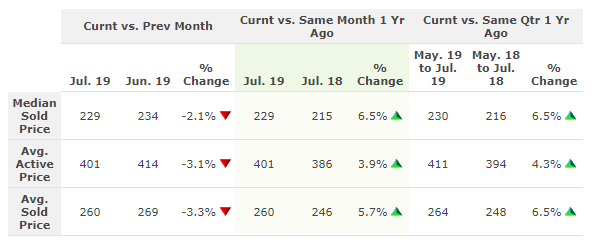
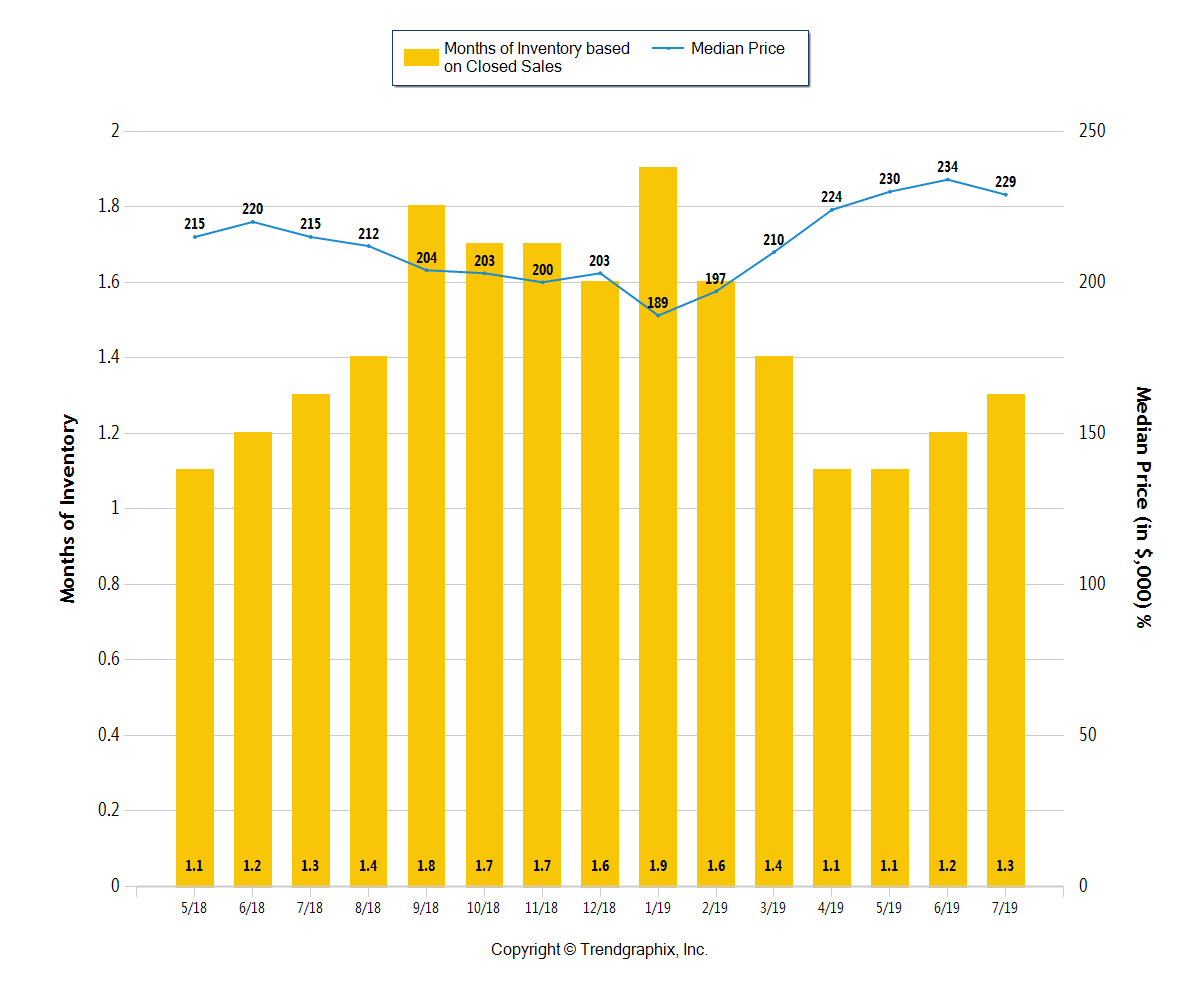
💲Central Ohio Housing Prices
The Median Sold Price trend is Neutral* The Median Sold Price for July 2019 was $229k.
• Down 2.1% compared to June 2019
• Up 6.5% compared to July 2018
The Average For Sale Price trend is Neutral.* The Average For Sale Price in July 2019 was $401k.
• Down 3.1% compared to June 2019
• Up 4.3% compared to July 2018
The Average Sold Price trend is Neutral.* The Average Sold Price in July 2019 was $260k.
• Down 3.3% compared to June 2019
• Up 5.7% compared to July 2018
*Based on 6 month trend – Appreciating/Depreciating/Neutral
🏘️ Central Ohio Months Of Inventory
It’s still a Seller’s Market* in Columbus, Ohio!
The Months of Inventory based on Closed Sales in July 2019 was 1.3.
• Up 8.3% compared to June 2019
• 0% compared to July 2018
*Seller’s market: less than 3 months of inventory based on closed sales
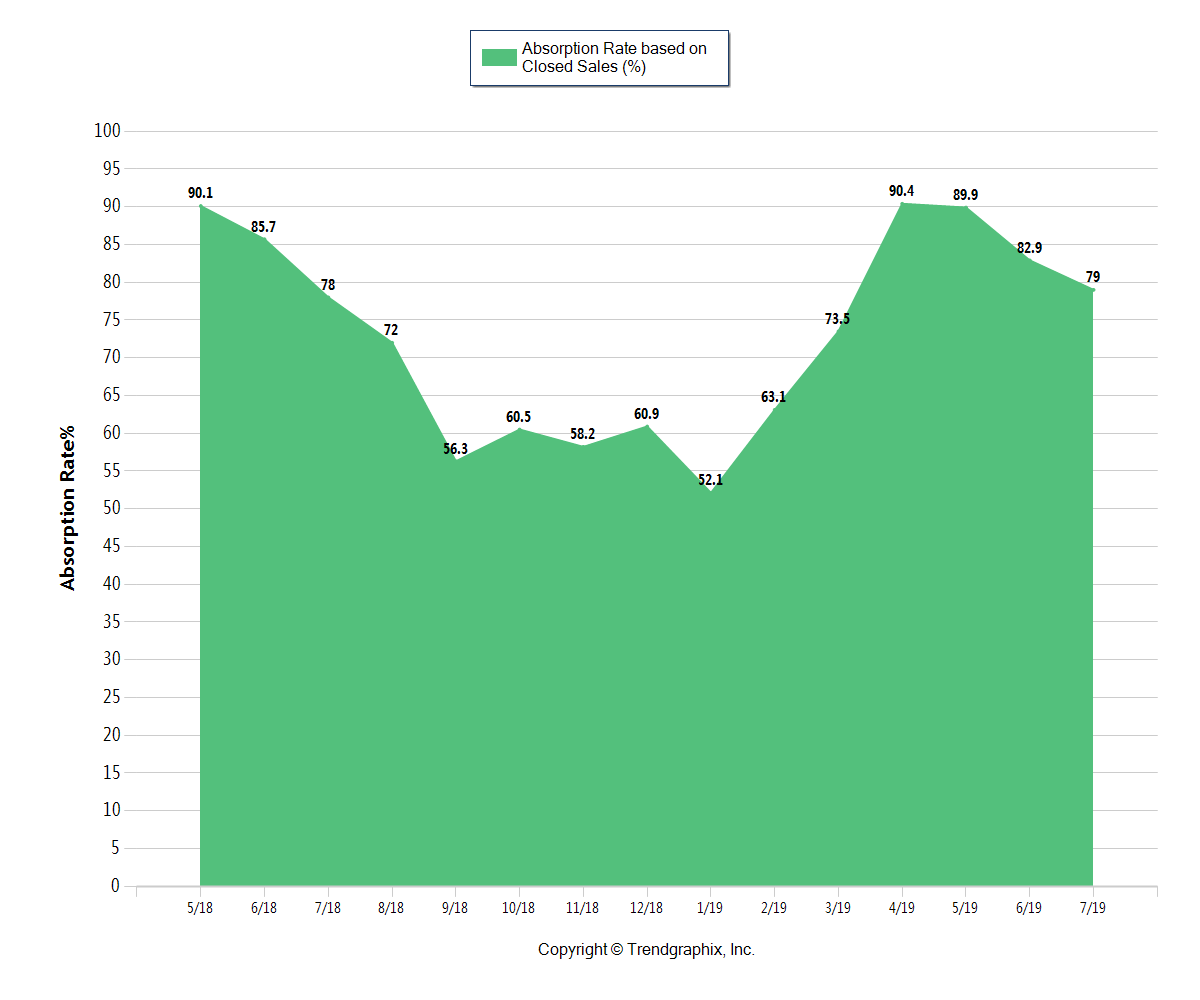
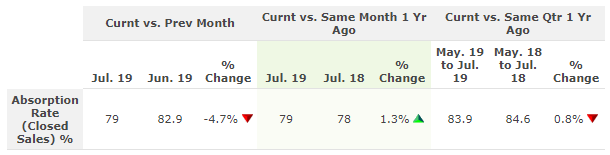
📈Central Ohio Absorption Rate
The Absorption Rate based on Closed Sales in July 2019 was 79.
• Down 4.7% compared to June 2019
• Up 1.3% compared to July 2018
*Seller’s market: 33.33% and above based on closed sales
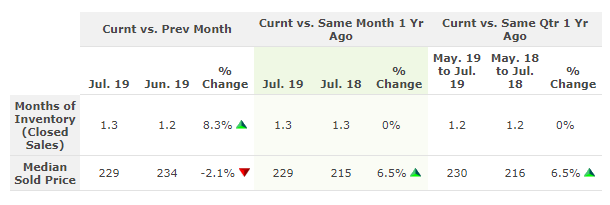
Central Ohio Housing Market Report At A Glance
Use this table to quickly see how the Columbus, Ohio area real estate market is doing.
Central Ohio Home Sellers
Are you planning to sell your home in the near future? We are in a seller’s market overall, so it may be the perfect time to list and sell before the winter. If you aren’t quite ready to sell, there are pros and cons to selling a home in the fall or winter. You have less competition, but home prices do tend to shift down and days on market tends to shift up. That said, a real estate agent who specialized in selling homes quickly and profitably will be able to help you sell fast for more even in the winter.
If you have questions about the home selling process in Columbus, Ohio, check out our Seller FAQ section.
Market conditions are different from one neighborhood to another and one price point to another. Call or text Columbus Realtor Rita Boswell at 614-830-9767 to learn more about market conditions in your specific community.
Get Your Home’s Value InstantlyColumbus OH Home Buyers
Mortgage rates are moving down again, and home values in the Columbus area are predicted to continue to rise, so it’s a great time to buy a home. Combine those factors with the coming fall/winter slowdown, and it may just be the perfect time to start your home search.
It is still a seller’s market, so make sure your financials are in order before finding the perfect home. Fix any issues with your credit, and talk with a mortgage professional to get pre-approved.
Work with a Top Home Buying Agent to help you find homes that fit your needs and budget. Be ready to make a competitive offer when you find the right home.
Browse Today’s Newest ListingsAbout Central Ohio Real Estate Market Reports
“At the Rita Boswell Group, our goal is to provide home buyers and sellers with the most recent, in-depth market information possible.
Our report is based on data supplied by the Columbus Board of Realtors or its MLS. Information is deemed reliable but not guaranteed. Specific data points provided above may be adjusted, which will be reflected in future reports.
Our Central Ohio real estate market reports cover the counties of Franklin, Delaware, Fairfield, Licking, Madison, Pickaway, and Union. For market information on a specific community, contact Realtor Rita Boswell at 614-830-9767.”