Birds are singing, flowers are blooming… and the market is heating up! Literally, Columbus was just named the Hottest Market in the US. If you’re thinking about buying a home, what better way to enjoy the lovely weather than to go see some homes for sale!
Read More to see how the Central Ohio real estate market did in March and to view trends.
- 🏘️ Central Ohio Homes For Sale, Listed, Sold, & Pending
- 📐Central Ohio Average Price Per Square Foot
- 📉Central Ohio Days on Market
- 💲Central Ohio Home Prices
- 🏘️ Central Ohio Months Of Inventory
- 📈Central Ohio Absorption Rate
- Central Ohio Real Estate Market Report At A Glance
- Central Ohio Home Sellers
- Columbus OH Home Buyers
🏘️ Central Ohio Homes For Sale, Listed, Sold, & Pending
The number of Homes For Sale in March 2019 was 2809 units.
•  Up 6.6% compared to Feb 2019
• Up 10.9% compared to March 2018
The number of Homes Listed in March 2019 was 2931 units.
• Up 41.5% compared to Feb 2019
•  Down 5.5% compared to March 2018
The number of Homes Closed in March 2019 was 1972 units.
• Up 19.5% compared to Feb 2019
• Down 12.4% compared to March 2018
The number of Homes Placed Under Contract in March 2019 was 3088 units.
• Up 51.2% compared to Feb 2019
• Up 17.9% compared to March 2018


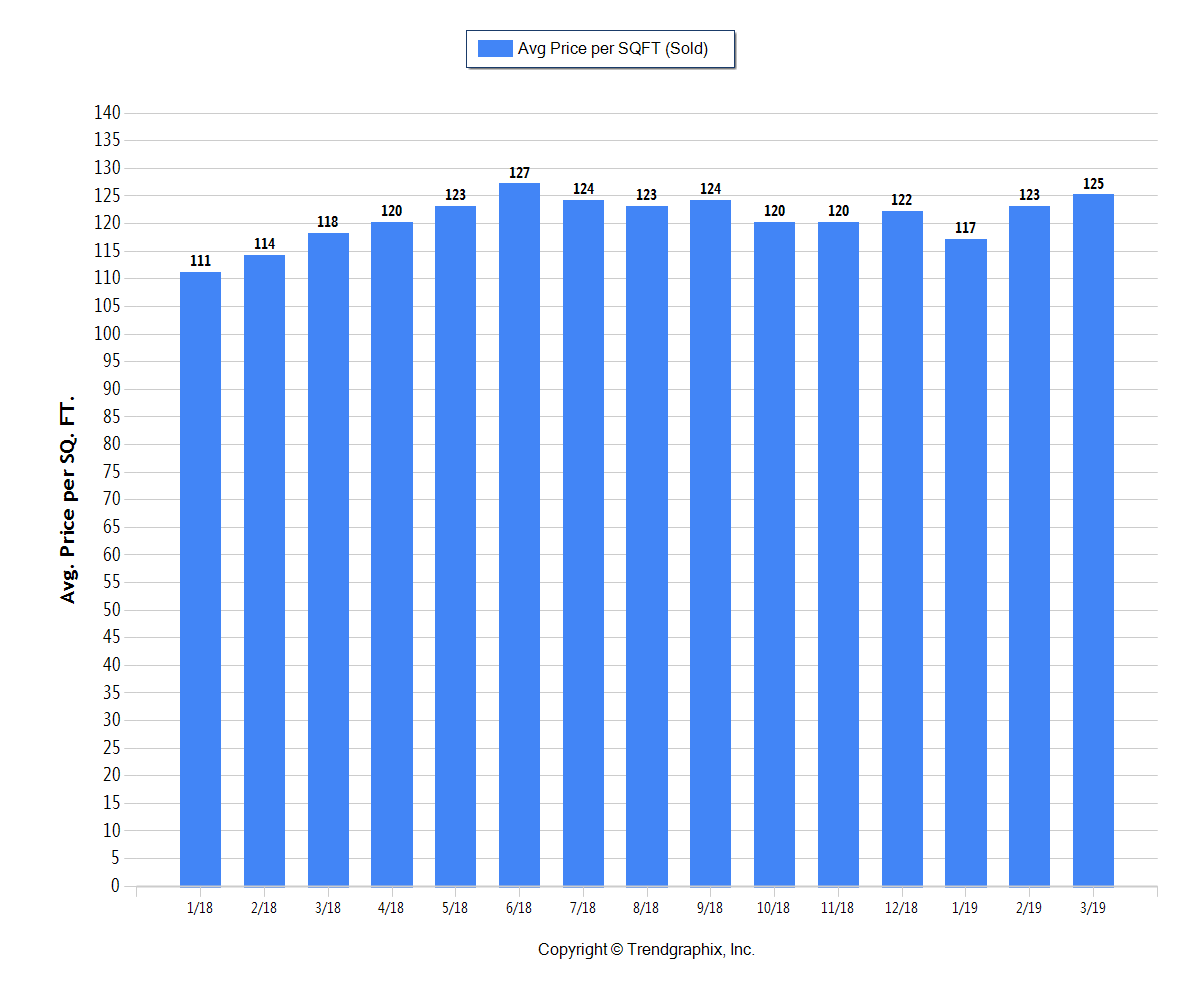
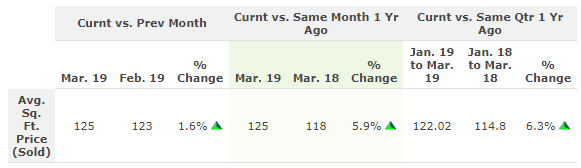
📐Central Ohio Average Price Per Square Foot
The Average Price per Square Foot on Sold homes trend was Appreciating.* In March 2019 the Average Price Per Square Foot was $125.
• Up 1.6% compared to Feb 2019
• Up 5.9% compared to March 2018
*Based on 6 month trend – Appreciating/Depreciating/Neutral
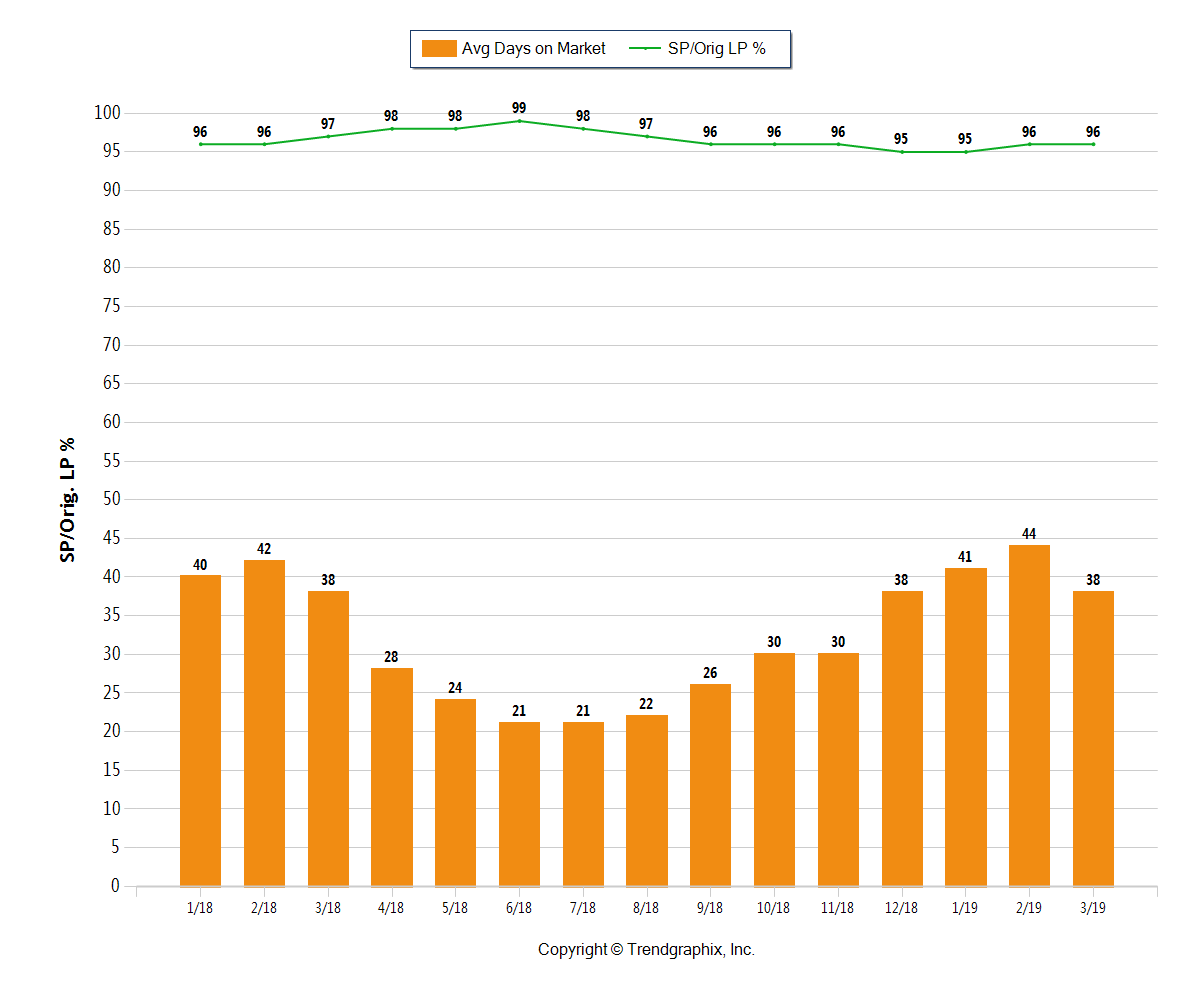
📉Central Ohio Days on Market
The average Days On Market trend in the Columbus area is Steady.*
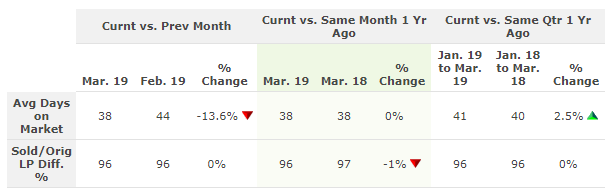
The Average Days on Market in March 2019 was 38 days.
• Down 13.6% compared to Feb 2019
• 0% compared to March 2018
The Sold/Original List Price Ratio remained Steady* at 96% for March 2019.
• 0% compared to Feb 2019
• Down 1% compared to March 2018
*Based on 6 month trend – Rising/Falling/Remains Steady
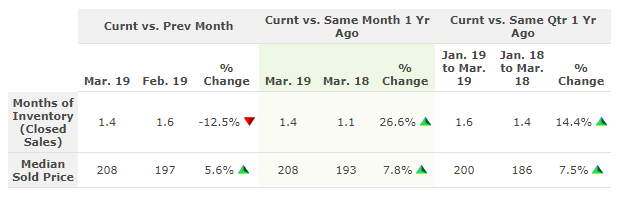
💲Central Ohio Home Prices
The Median Sold Price trend remains Neutral.* The Median Sold Price for March 2019 was $208k.
• Up 5.6% compared to Feb 2019
• Up 7.8% compared to March 2018
The Average For Sale Price trend is Appreciating.* The Average For Sale Price in March 2019 was $403k.
• Up 3.9% compared to Feb 2019
• Up 2.8% compared to March 2018
The Average Sold Price trend remains Neutral.* The Average Sold Price in March 2019 was $244k.
• Up 6.1% compared to Feb 2019
• Up 6.6% compared to March 2018
*Based on 6 month trend – Appreciating/Depreciating/Neutral


🏘️ Central Ohio Months Of Inventory
It’s still a Seller’s Market* in Columbus, Ohio!
While down compared to last month, inventory again rose compared to the same time last year.
The Months of Inventory based on Closed Sales in March 2019 was 1.4.
• Down 12.5% compared to Feb 2019
• Up 26.6% compared to March 2018
*Seller’s market: less than 3 months of inventory based on closed sales

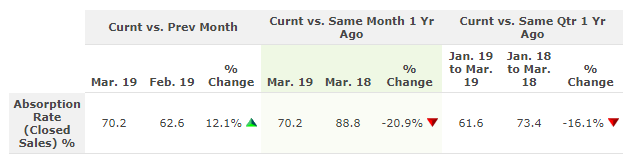
📈Central Ohio Absorption Rate
The Absorption Rate based on Closed Sales in March 2019 was 70.2.
• Up 12.1% compared to Feb 2019
• Down 20.9% compared to March 2018
*Seller’s market: 33.33% and above based on closed sales

Central Ohio Real Estate Market Report At A Glance

Use this table to quickly see how the Columbus, Ohio area real estate market is doing.

Central Ohio Home Sellers
Planning to sell your home? A Seller’s Market* is the ideal time to do it. Plus, listing in the spring has the advantages of good weather and more home shoppers.

If you want to sell your home this spring, talk with a top Columbus real estate agent.
Call or text Columbus Realtor Rita Boswell at 614-830-9767 to learn more about market conditions in your specific community.
Get Your Home’s Value InstantlyColumbus OH Home Buyers
Rising inventory may be a good sign for struggling buyers.
There will still be heavy competition in the lower price ranges. This is due to persistently low inventory and higher demand.
If you’re serious about buying a home, be ready before finding the perfect home. Talk with a mortgage professional to determine your budget.
Work with a Top Home Buyer Agent to help you find homes that fit your needs and budget. Be prepared to make a competitive offer when you find the right home.
About Central Ohio Real Estate Market Reports
“At the Rita Boswell Group, our goal is to provide home buyers and sellers with the most recent, in-depth market information possible.
Our report is based on data supplied by the Columbus Board of Realtors or its MLS. Information is deemed reliable but not guaranteed. Specific data points provided above may be adjusted, which will be reflected in future reports.
Our Central Ohio real estate market reports cover the counties of Franklin, Delaware, Fairfield, Licking, Madison, Pickaway, and Union. For market information on a specific community, contact Realtor Rita Boswell at 614-830-9767.”