The Columbus housing market is HOT!!🔥🔥🔥 Homes are selling fast, home prices are up, and inventory is way down.
Keep reading to see how the Columbus Ohio Real Estate Market did in May and to view trends. We’ve also included “Today’s Stats” to help you see where we are as of this writing on June 15, 2020.
If you need to buy or sell a home, please contact us at 614-830-9767. You can always start your home search online from the comfort of your couch at RitaBoswellGroup.com. You can even find sold homes on our site!
- 🏘️ Central Ohio Homes For Sale, Listed, Sold, & Pending
- 📐Central Ohio Average Price Per Square Foot
- 📉Central Ohio Days on Market
- 💲Central Ohio Housing Prices
- 🏘️ Central Ohio Months Of Inventory
- 📈Central Ohio Absorption Rate
- Central Ohio Housing Market Report At A Glance
- Central Ohio Home Sellers
- Columbus OH Home Buyers
🏘️ Central Ohio Homes For Sale, Listed, Sold, & Pending
The number of Homes For Sale in May 2020 was 2395 units.
•  Up 0.8% compared to April 2020
•  Down 28.3% compared to May 2019
The number of Homes Listed in May 2020 was 2918 units.
• Up 17.2% compared to April 2020
• Down 27.4% compared to May 2019
The number of Homes Closed in May 2020 was 2299 units.
• Up 10.4% compared to April 2020
• Down 23.9% compared to May 2019
The number of Homes Placed Under Contract in May 2020 was 3328 units.
• Up 36.8% compared to April 2020
• Up 7% compared to May 2019
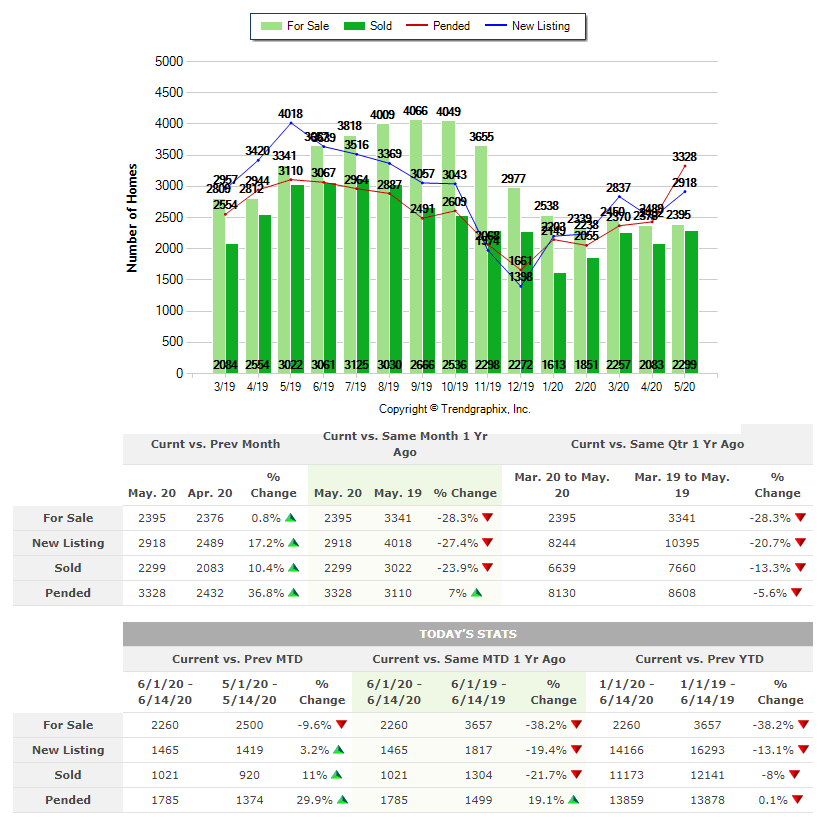
Quick Guide: For Sale vs. Sold vs. Pending
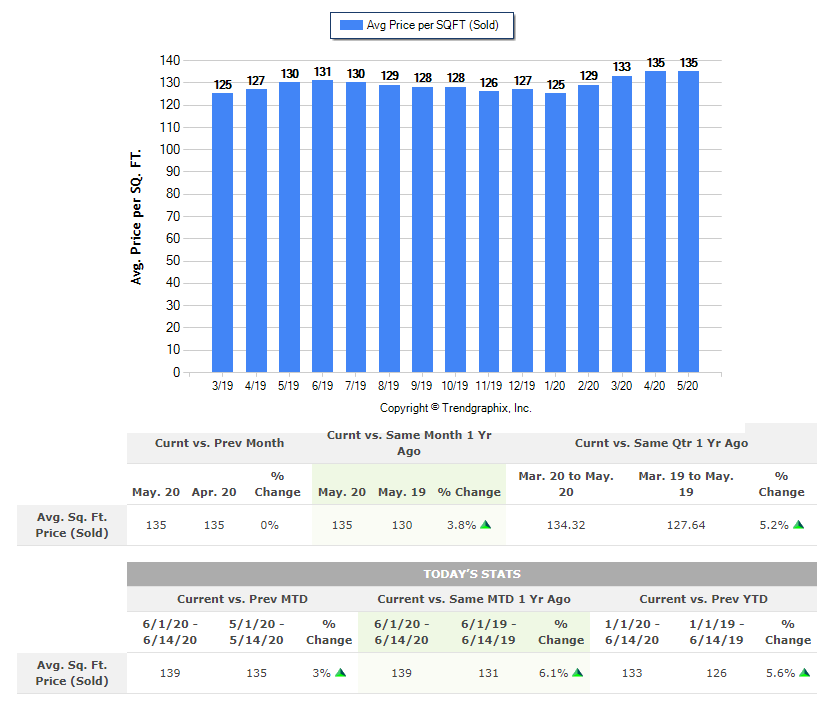
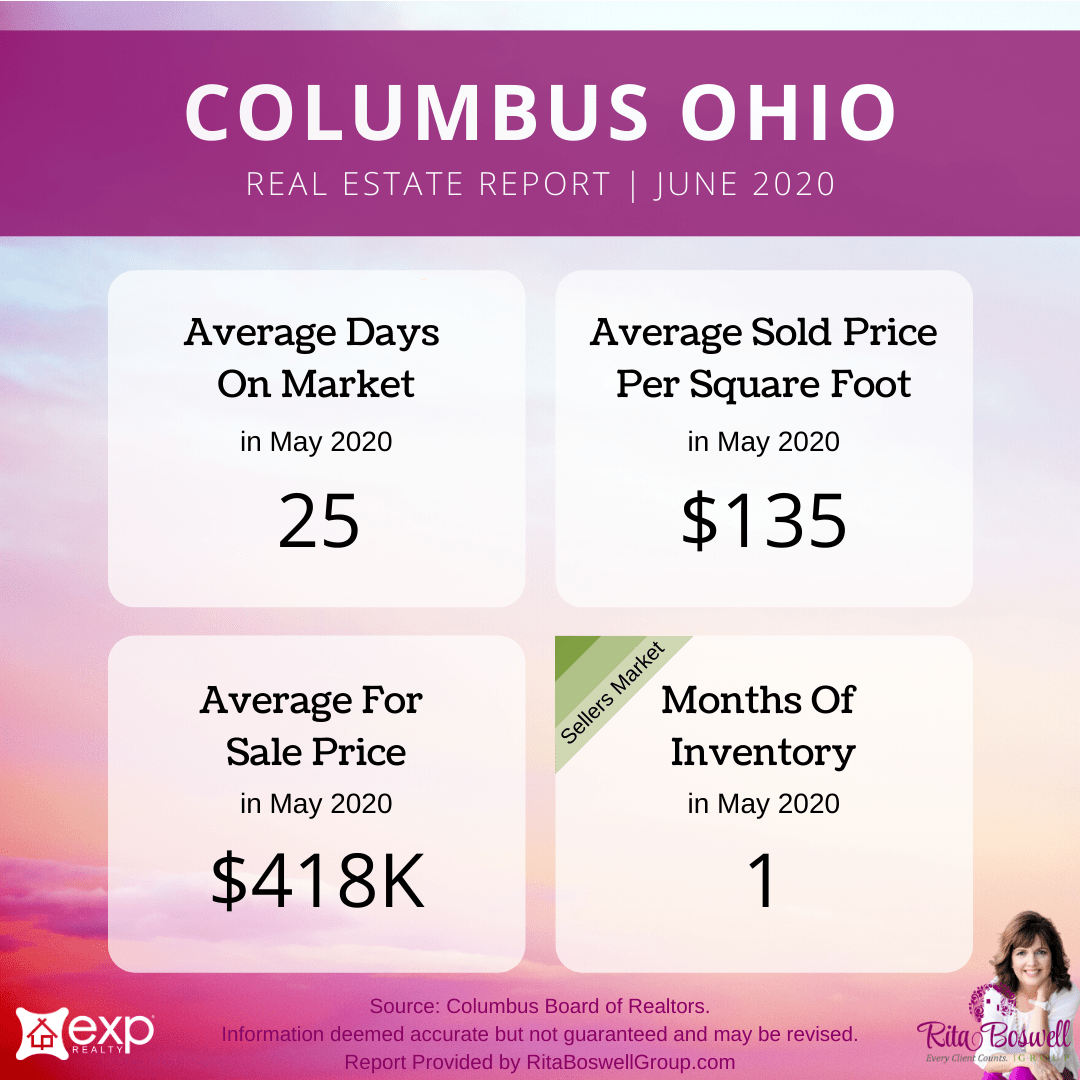
📐Central Ohio Average Price Per Square Foot
The Average Price per Square Foot on Sold homes trend is Appreciating.* In May 2020 the Average Price Per Square Foot was $135.
• 0% compared to April 2020
• Up 3.8% compared to May 2019
*Based on 6-month trend – Appreciating/Depreciating/Neutral
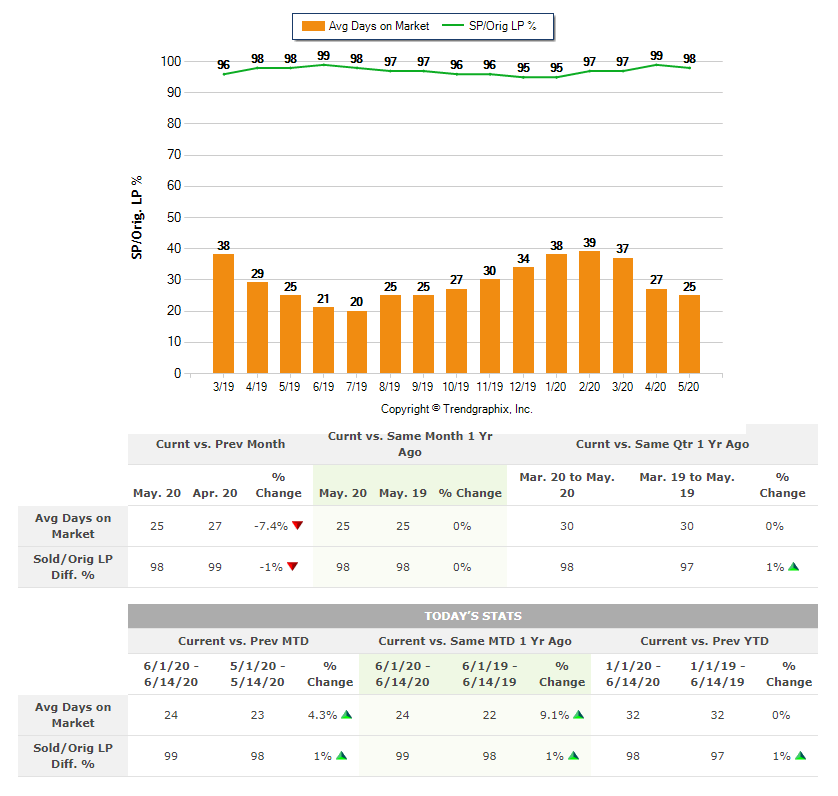
📉Central Ohio Days on Market
The average Days On Market trend in the Columbus area is Falling.*
The Average Days on Market in May 2020 was 25 days.
• Down 7.4% compared to April 2020
• 0% compared to May 2019
The Sold/Original List Price Ratio remains Steady* at 98% for May 2020.
• Down 1% compared to April 2020
• 0% compared to May 2019
*Based on 6-month trend – Rising/Falling/Remains Steady
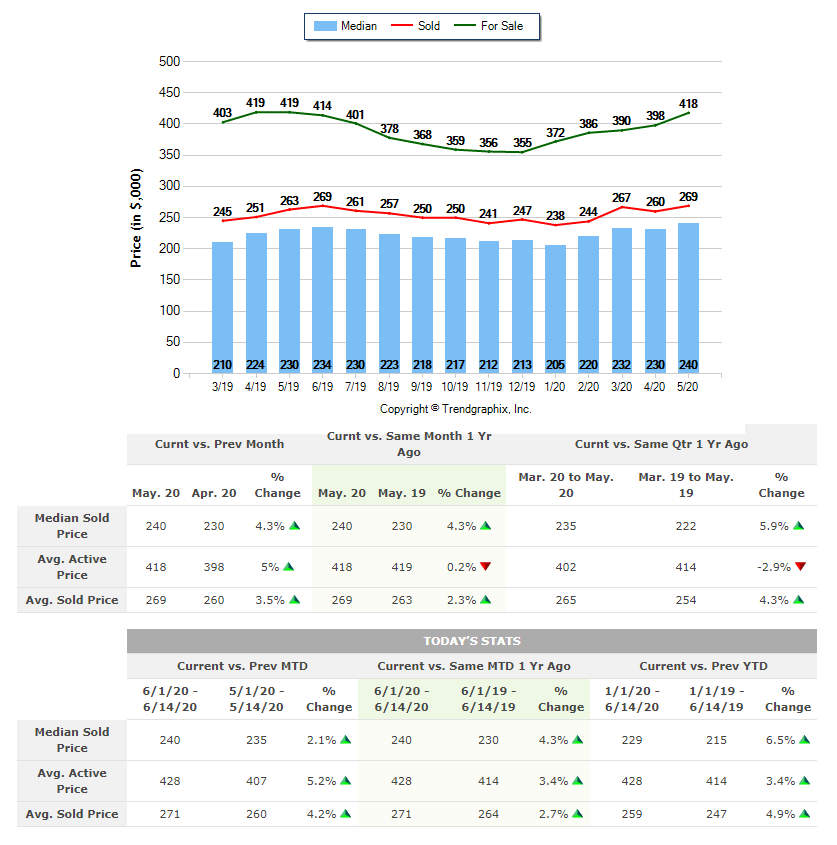
💲Central Ohio Housing Prices
The Median Sold Price trend is Appreciating* The Median Sold Price for May 2020 was $240k.
• Up 4.3% compared to April 2020
• Up 4.3% compared to May 2019
The Average For Sale Price trend is Appreciating.* The Average For Sale Price in May 2020 was $418k.
• Up 5% compared to April 2020
• Down 0.2% compared to May 2019
The Average Sold Price trend is Appreciating.* The Average Sold Price in May 2020 was $269k.
• Up 3.5% compared to April 2020
• Up 2.3% compared to May 2019
*Based on 6-month trend – Appreciating/Depreciating/Neutral
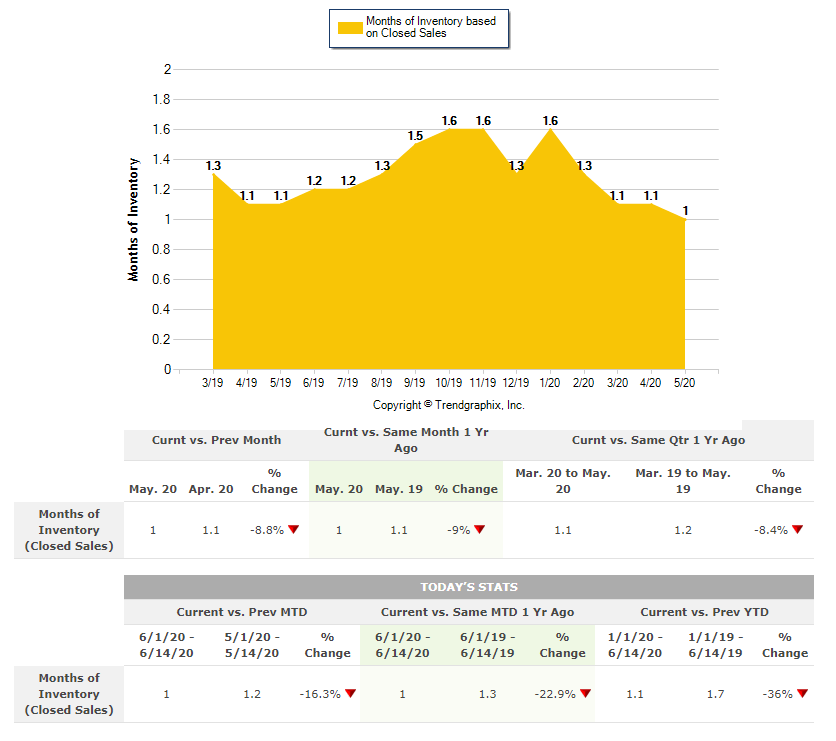
🏘️ Central Ohio Months Of Inventory
It is still a Seller’s Market* in Columbus, Ohio!!!
The Months of Inventory based on Closed Sales in May 2020 was down to just 1.😮
• Down 8.8% compared to April 2020
• Down 9% compared to May 2019
*Seller’s market: less than 3 months of inventory based on closed sales
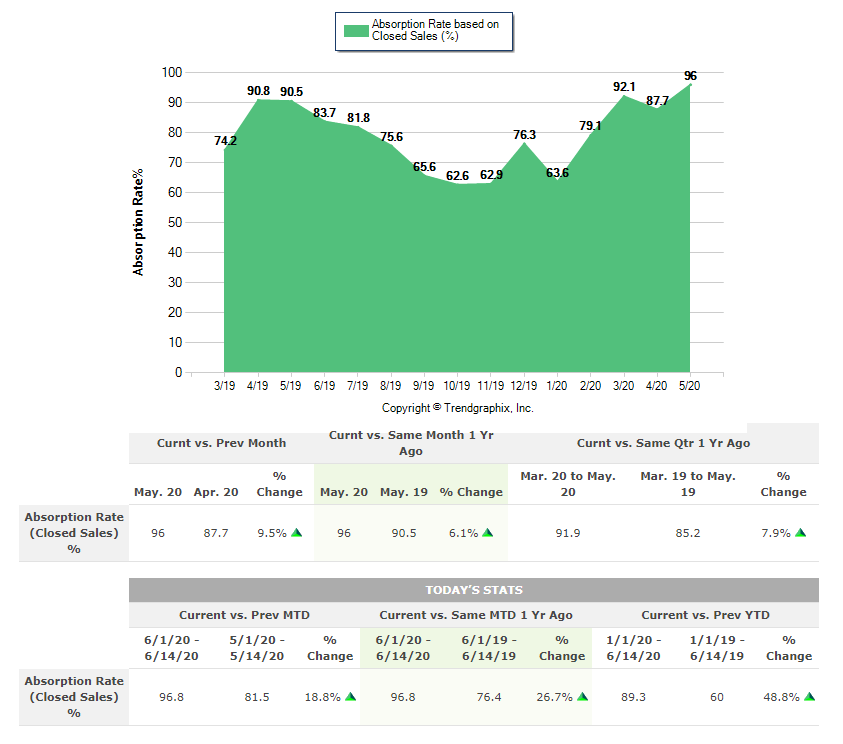
📈Central Ohio Absorption Rate
The Absorption Rate based on Closed Sales in May 2020 was 96.
• Up 9.5% compared to April 2020
• Up 6.1% compared to May 2019
*Seller’s market: 33.33% and above based on closed sales
Central Ohio Housing Market Report At A Glance
Use this table to quickly see how the Columbus, Ohio area real estate market is doing.
Central Ohio Home Sellers
May remained in a Seller’s Market in Central Ohio. Based on “Today’s Stats” in the above tables, June is also likely to be a Seller’s Market
Housing inventory is extremely low, and the market needs listings. If you have thought at all about selling your home in Central Ohio, please call or text Realtor Rita Boswell at 614-830-9767.
Get Your Home’s Value InstantlyQuestions about the home selling process? Check out our Seller FAQ section.
Please Note: Market conditions vary between neighborhoods and price points. Call or text Columbus Realtor Rita Boswell at 614-830-9767 to learn more about market conditions in your specific community.
Columbus OH Home Buyers
Interest rates will likely remain low for the foreseeable future, and home values are predicted to continue to rise in Columbus over the long term. So, even though it’s a Seller’s Market, buying a home remains a great investment.
Browse Price Reduced Homes In Central OhioOne of the first steps of buying a home is getting pre-approved. Connect with a mortgage professional to get started with pre-approval.
Browse Today’s Newest ListingsAbout Central Ohio Real Estate Market Reports
“At the Rita Boswell Group, our goal is to provide home buyers and sellers with the most recent, in-depth market information possible.
Our report is based on data supplied by the Columbus Board of Realtors or its MLS. Information is deemed reliable but not guaranteed. Specific data points provided above may be adjusted, which will be reflected in future reports.
Our Central Ohio real estate market reports cover the counties of Franklin, Delaware, Fairfield, Licking, Madison, Pickaway, and Union. For market information on a specific community, contact Realtor Rita Boswell at 614-830-9767.”